October 9, 2024 by Dan Mitchell @ International Liberty
Some folks on the left say the Laffer Curve is a fantasy concocted by economic charlatans. Some folks on the right say the Laffer Curve is real and that all tax cuts are self-financing. Both are wrong.
- When I talk to folks on the left, I tell them that even Paul Krugman admits there is a revenue-maximizing tax rate and that revenues will fall if the rate goes above that level.
- When I talk to folks on the right, I tell them about the revenue-maximizing tax rate and remind them that tax revenues will fall if the rate drops below that level.
All this is common sense. When giving lectures about the Laffer Curve, I often begin by asking the audience what would happen if a pizza restaurant doubled its prices? Would revenues double? Almost everyone correctly says no. They instinctively understand that most customers will go to other restaurants or eat at home.

I then ask what would happen if politicians doubled tax rates? Would tax revenues double? Once again, almost everyone correctly says no. They instinctively understand that many taxpayers will change their behavior in ways that would limit the amount of new revenue being collected (as confirmed by a survey of certified public accountants who specialize in taxes).
It’s reasonable to think revenues will climb if there’s a big increase in tax rates, but the government obviously won’t collect twice as much money.
I call this the “prudent understanding of the Laffer Curve” and this is Part III in my series (feel free to peruse Part I and Part II).
I’m addressing this issue today because of a column just published by Bloomberg. Authored by Rick Pearlstein, it portrays the Laffer Curve and supply-side economics as a “fairy tale.” Here are some excerpts.
Donald Trump’s…statement that after he signed the Tax Cuts and Jobs Act into law in 2017, the federal government “took in more revenues the following year than we did when the tax rate was much higher.” …Trump’s bunkum repeated an article of right-wing faith: Federal tax cuts “pay for themselves,”…
The story starts in the 1970s with…“supply-side theory,”… Arthur Laffer—a real-life economist who attached himself to the project after inception—claimed the whole thing could be distilled into a single chart. …All it took was fixing tax rates at precisely the correct point—the apex of the so-called Laffer curve. …by the end of Reagan’s presidency…
Republicans…had locked themselves into thinking that tax cuts did result in higher government revenue. …just this September, Trump said that with the even more ambitious tax cuts he’s promising—an assortment that includes everything from further reductions to the rates on corporate income to special exemptions for tipped workers and senior citizens—“I look forward to having no deficits within a fairly short period of time.” Being on the supply side means never having to say you’re sorry.
Is Pearlstein correct that many Republicans overstate and exaggerate? Of course. But does that mean that the core insights of supply-side theory are wrong? Of course not. For readers who want to get into the details, this column from 2014 debunked a similar straw-man attack on the Laffer Curve.
For purposes of today’s column, I’m simply going to share some IRS data on tax revenues in the 1980s. I challenge Mr. Pearlstein (or anyone else) to give their explanation for why the rich paid five times as much tax revenue after Reagan reduced their tax rate from 70 percent to 28 percent.
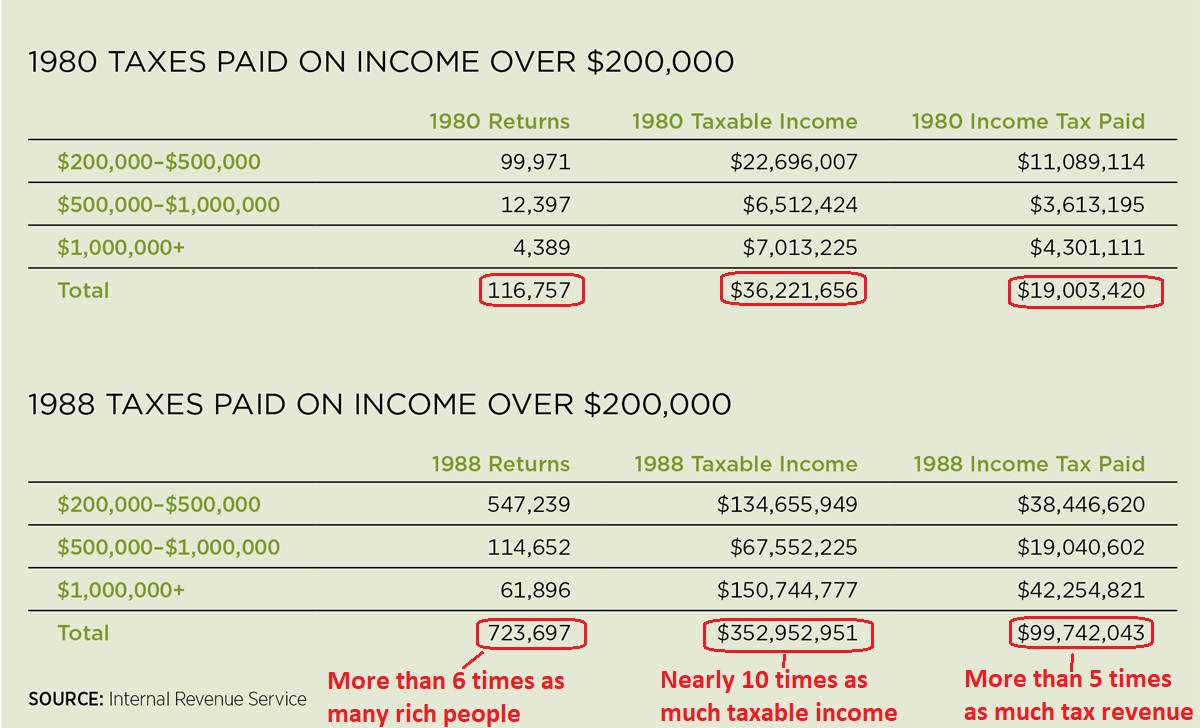
What happened with rich people in the 1980s is an (admittedly rare) example of lower tax rates producing more revenue.
I’m citing this data not to claim that other tax cuts are self-financing, but instead to provide some evidence that is indisputable even to folks on the left. Suffice to say I’ve been sharing this data for decades and I’ve yet to have anyone provide an alternative explanation for why the rich dramatically increases their tax payments.
P.S. Our friends on the left sometimes have bumper stickers that say “Think globally, act locally.” With that in mind, here are six city-specific examples (here, here, here, here, here, and here) of the Laffer Curve.
No comments:
Post a Comment