Search This Blog

De Omnibus Dubitandum - Lux Veritas

Showing posts with label Laffer Curve. Show all posts

Friday, August 1, 2025

The Laffer Curve Triumphs Again: Class Warfare in the United Kingdom Backfires

July 31, 2025 by Dan Mitchell @ International Liberty

The Laffer Curve provides incredibly important insights about tax policy.


Most important, it informs us that you don’t measure the revenue impact of tax policy changes merely by looking at what is happening to tax rates. You also have to consider whether changes in tax rates will alter incentives to earn and report income.

Or, in the case of sales taxes and trade taxes, incentives to buy things. .Or, in the case of capital gains, incentives to sell assets. And that last example is our topic today.

The economic luddites in the United Kingdom have been engaging in class-warfare fiscal policy, including tax increases on investors. That approach, to put it mildly, has backfired.

Here are some excerpts from a story in the U.K.-based Financial Times by Emma Agyemang.


The UK’s efforts to increase revenues from capital gains tax have backfired, with receipts plummeting in the wake of big cuts in allowances. The government’s CGT take fell 18 per cent from the previous year to £12.1bn in the 2023-24 fiscal year, even as the annual tax-free allowance was halved from £12,300 to £6,000, according to data released by HM Revenue & Customs on Thursday. Separate provisional figures — calculated using a different methodology and published earlier in the week by HMRC — indicated a further 10 per cent drop in CGT receipts in 2024-25. … 

The slashing of allowances by the previous Conservative government in 2023-24 made an additional 87,000 taxpayers potentially liable for CGT, taking the total number exposed to the tax to 378,000. The tax-free allowance was halved again to £3,000 a year in 2024-25. Reeves also increased CGT rates in her Budget last October to between 18 and 32 per cent — up from the previous rates of between 10 and 28 per cent.

And here’s part of Temie Laleye’s report for GB News.


CGT receipts fell to £11.8 billion in the first half of 2025, down from £13.5 billion during the same period in 2024. This marks a £1.7 billion drop in Government income. The fall follows the Chancellor’s October 2024 Budget, which introduced immediate changes to CGT rates. Basic rate taxpayers saw their CGT rate rise from 10 per cent to 18 per cent, while higher rate taxpayers faced an increase from 20 per cent to 24 per cent. … 

Annual CGT revenues have already been falling. In 2022 to 2023 they stood at around £17 billion, dropping to £14.5 billion in 2023 to 2024 and just £13.1 billion in 2024 to 2025. …the CGT increases have led to taxpayers rearranging their finances to avoid higher bills. …Wealthier individuals, in particular, have responded by adjusting the timing and structure of their asset disposals to minimise tax exposure. The Government had projected that the CGT changes would raise £90 million in 2024 to 2025 and £1.44 billion in 2025 to 2026. But the latest data suggests those forecasts are likely to fall far short.

If there was a prize for understatement, “likely to fall far short” would win a prize.

It’s not just that the tax increases are not producing as much revenue as politicians hoped. All the evidence is that the government is actually losing money.

That being said, it’s quite possible that the long-run effect won’t be as harmful as the short-run effect, at least with regard to tax revenue (as you can read here, here, and here, I’m a big advocate of prudence over exaggeration when considering the Laffer Curve and its consequences).

But even if the tax increases eventually collect additional revenue, the real issue is whether letting politicians have more money is worth the damage to the private sector.

I’ll close by explaining the real problem in the United Kingdom, which is that politicians from both parties have been squandering money at a reckless rate (see chart).

As the burden of government spending climbs, they invariably think of different ways of diverting more money from the productive sector of the economy.

I don’t expect that self-destructive cycle to end anytime soon.

The United Kingdom needs another Margaret Thatcher, or the British version of Javier Milei. I’m not optimistic.


Monday, February 10, 2025

Goldilocks and the Laffer Curve

Other than Art Laffer, I think of myself as the world’s biggest advocate of the Laffer Curve.

I’ve literally written hundreds of columns explaining and promoting the concept.

My goal is to help people understand that there is not a linear relationship between tax rates and tax revenue.

Why is this the case?

Because when tax rates change, incentives to earn and report income also change.

This is obvious when you think about big shifts in policy.

  • You obviously don’t double tax revenues if you double tax rates.
  • You clearly don’t cut tax revenues by 50 percent if you cut tax rates in half.

While I’m a huge advocate of the Laffer Curve in theory, I actually have very moderate views about the Laffer Curve in practice.

For instance, I don’t think the Laffer Curve means all tax cuts pay for themselves. That only happens in very rare circumstances (see here and here).

Moreover, some types of tax cuts produce very little revenue feedback. 


There are only significant effects if marginal tax rates change and taxpayers have considerable control over the timing, level, and composition of their income.

So I consider myself to be the Goldilocks of the Laffer Curve.

But instead of looking for porridge that isn’t too hot or too cold, I’m looking for revenue estimates that aren’t too high or too low.

Indeed, that’s the basis of my three-part series (see here, here, and here) on the prudent understanding of the Laffer Curve.

I’m providing all this background because Republicans may be greatly exaggerating the benefits of extending the Trump tax cuts.

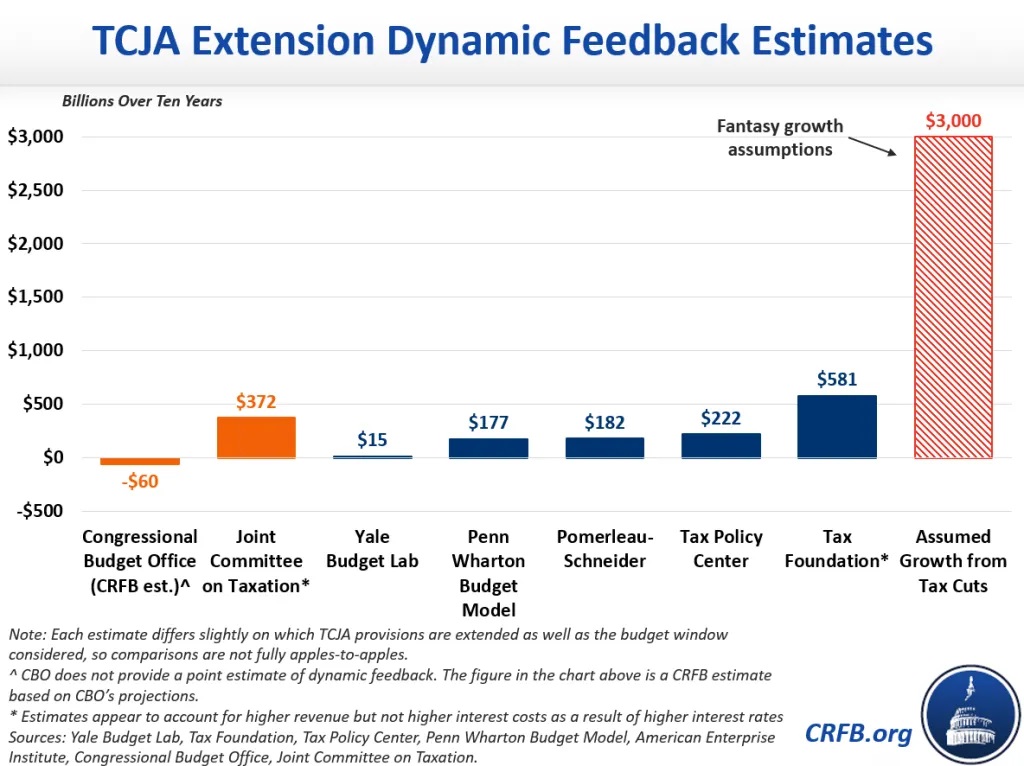
Here’s a chart from the Committee for a Responsible Federal Budget. It shows various estimates of how much additional revenue might be generated because of faster growth. As you can see, Republicans are predicting almost six times as much revenue feedback as the next-highest estimate.

For what it’s worth, some of the above models are based on sensible microeconomic principles. Others are based on Keynesian economics and (in my humble opinion) not very credible.

Speaking of credibility, Jessica Riedl* has a column on this issue in Reason and argues that the Republican approach is very unrealistic.

Here are some excerpts.


How can Washington possibly pay for trillions more in promises on top of this unsustainable debt? According to Republicans in Washington, it’s simple. Just grow the economy so fast that the resulting revenues will pay for it all. …The most recent House Republican budget resolution assumes that rapid economic growth will save $3 trillion over the decade, as well as possibly finance $4 trillion in tax cut extensions. …In reality, these politician promises of aggressively accelerated economic growth are a lazy, longstanding gimmick… and…wishful thinking… Sure, policymakers should aspire to such growth, yet basing the federal budget on that assumption is reckless. …

Even with smart policies encouraging capital investment…, labor productivity rates are difficult to reliably improve. They are especially difficult to expand by building an economic wall around the country with steep tariffs… Economic growth can solve a lot of problems, but entitlement-and-interest-driven budget deficits leaping towards $4 trillion within the decade is not one of them. …

A family should not purchase a home it cannot afford in the hope that their salaries will somehow double next year. Similarly, lawmakers should not enact trillions of dollars of unaffordable policies in the hope that productivity growth rates will somehow quickly double—especially when there is no backup plan.

So why are Republicans making super-aggressive assumptions about economic growth and revenue feedback?

The answer is that they are unwilling to restrain government spending.

I’ll close by warning that this Santa Claus approach is a recipe for big future tax increases.

*Jessica Riedl used to be Brian Riedl. One good thing about being a libertarian is that you don’t care about the sexuality or gender of other adults.

Monday, December 23, 2024

Academic Research Estimating the Laffer Curve

 December 17, 2024 by Dan Mitchell @ International Liberty

Some people say the Laffer Curve is the economic version of Goldilocks.

But instead of being a story about whether the porridge is too hot, too cold, or just right, it’s a story about whether tax rates are too high, too low, or just right.

But I’ve never liked that analogy because it implies the revenue-maximizing tax rate is “just right.”

At the risk of understatement, we don’t want to maximize revenue for politicians.

The goal should be to set tax rates at the growth-maximizing level (raising the small amount of revenue needed to finance the legitimate and proper functions of government).

That being said, it is very instructive to examine research on the topic because even our leftist friends hopefully don’t want tax rates set so high that the government loses revenue.

As such, if the goal is revenue maximization, there’s a fascinating new study that has been published by the Scandinavian Journal of Economics.

The authors, Marie-Noëlle Lefebvre, Etienne Lehmann, and Michaël Sicsic, wrote a summary of their study for VoxEU. Here’s the issue they addressed.


Capital income taxation has re-emerged as a pressing issue, particularly with rising income inequality. …However, capital income taxation also induces more behavioural responses than labour income taxation, thereby diminishing its efficiency. …In a recent paper…, we contribute to a deeper understanding of capital income taxation, both theoretically and empirically, by estimating the ‘Laffer rate’ on capital income tax for France. The Laffer rate is the tax rate above which increasing the rate further would compress tax bases enough to reduce government revenue. We express the Laffer tax rate on capital income using direct elasticity (capital income response) and cross-elasticity (labour income response) to the net-of-tax rate on capital income. …The Laffer rate on capital income depends not only on the direct elasticity of capital income to its net-of-tax rate but also on the cross-elasticity of labour income to the net-of-tax rate on capital income.

And here are their key findings.

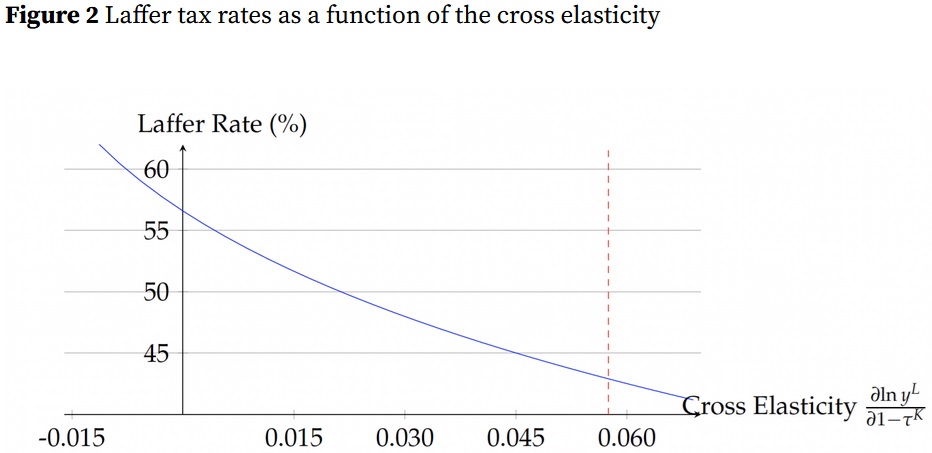
…the 2013 reform provides valuable insights… We therefore go further…by estimating elasticities of capital and labour income with respect to marginal net-of-tax rates (MNTRs) of both labour income and capital incomes. This allows us to estimate sufficient statistics to implement the Laffer formula. …Ignoring cross-response, this estimate leads to a Laffer rate on capital income of approximately 57%. …Moreover, we obtain statistically significant and slightly positive cross elasticities of labour income with respect to marginal net-of-tax rates on capital incomes. …These results suggest that the cross-elasticity is more likely explained by the impact of capital taxation on the incentive to work and save: an increase in the marginal tax rate on capital reduces the benefit of earning additional income from activity in order to save. Accounting for this cross-elasticity reduces the estimated Laffer rate significantly, to about 43%.

For non-wonky readers, what the authors basically found is that the revenue-maximizing tax rate on capital income is lower when you factor in the combined impact of changes in capital income and labor income.

How much lower? It depends on the degree to which taxpayers change their behavior, which is captured in Figure 2 from the VoxEU summary.

This is very interesting research.

I’ll add two points.

First, I’d be interested in how they define capital income. That’s not clear from the VoxEU summary and the actual study is behind an expensive paywall.

Second, I want to emphasize that it is pointlessly destructive to try to set tax rates at or near the revenue-maximizing level. This is because enormous amounts of private sector income are lost in exchange for very small amounts of additional tax revenue.

Regarding that second point, here are some excerpts from a study I summarized about a dozen years ago.

…labor taxes could be approximately doubled before getting to the downward-sloping portion of the curve. But notice that this means that tax revenues only increase by about 10 percent. …this study implies that the government would reduce private-sector taxable income by about $20 for every $1 of new tax revenue. …

What about capital taxation? According to the second chart, the government could increase the tax rate from about 40 percent to 70 percent before getting to the revenue-maximizing point. But that 75 percent increase in the tax rate wouldn’t generate much tax revenue, not even a 10 percent increase. So the question then becomes whether it’s good public policy to destroy a large amount of private output in exchange for a small increase in tax revenue.

Here’s an even better explanation of why higher tax rates are a net loser for society, this one involving higher tax rates on labor income.

I’ll close with the observation that U.S. tax rates on capital income already are very high when you measure the tax bias against income that is saved and invested.

P.S. I have a three-part series (here, here, and here) on the prudent case for the Laffer Curve.


Friday, October 11, 2024

The Prudent Case for the Laffer Curve, Part III

October 9, 2024 by Dan Mitchell @ International Liberty

Some folks on the left say the Laffer Curve is a fantasy concocted by economic charlatans. Some folks on the right say the Laffer Curve is real and that all tax cuts are self-financing.  Both are wrong.

  • When I talk to folks on the left, I tell them that even Paul Krugman admits there is a revenue-maximizing tax rate and that revenues will fall if the rate goes above that level.
  • When I talk to folks on the right, I tell them about the revenue-maximizing tax rate and remind them that tax revenues will fall if the rate drops below that level.

All this is common sense. When giving lectures about the Laffer Curve, I often begin by asking the audience what would happen if a pizza restaurant doubled its prices? Would revenues double?  Almost everyone correctly says no. They instinctively understand that most customers will go to other restaurants or eat at home.


I then ask what would happen if politicians doubled tax rates? Would tax revenues double?  Once again, almost everyone correctly says no. They instinctively understand that many taxpayers will change their behavior in ways that would limit the amount of new revenue being collected (as confirmed by a survey of certified public accountants who specialize in taxes).

It’s reasonable to think revenues will climb if there’s a big increase in tax rates, but the government obviously won’t collect twice as much money.

I call this the “prudent understanding of the Laffer Curve” and this is Part III in my series (feel free to peruse Part I and Part II).

I’m addressing this issue today because of a column just published by Bloomberg. Authored by Rick Pearlstein, it portrays the Laffer Curve and supply-side economics as a “fairy tale.” Here are some excerpts.


Donald Trump’s…statement that after he signed the Tax Cuts and Jobs Act into law in 2017, the federal government “took in more revenues the following year than we did when the tax rate was much higher.” …Trump’s bunkum repeated an article of right-wing faith: Federal tax cuts “pay for themselves,”…

The story starts in the 1970s with…“supply-side theory,”… Arthur Laffer—a real-life economist who attached himself to the project after inception—claimed the whole thing could be distilled into a single chart. …All it took was fixing tax rates at precisely the correct point—the apex of the so-called Laffer curve. …by the end of Reagan’s presidency…

Republicans…had locked themselves into thinking that tax cuts did result in higher government revenue. …just this September, Trump said that with the even more ambitious tax cuts he’s promising—an assortment that includes everything from further reductions to the rates on corporate income to special exemptions for tipped workers and senior citizens—“I look forward to having no deficits within a fairly short period of time.” Being on the supply side means never having to say you’re sorry.

Is Pearlstein correct that many Republicans overstate and exaggerate? Of course.  But does that mean that the core insights of supply-side theory are wrong? Of course not. For readers who want to get into the details, this column from 2014 debunked a similar straw-man attack on the Laffer Curve.

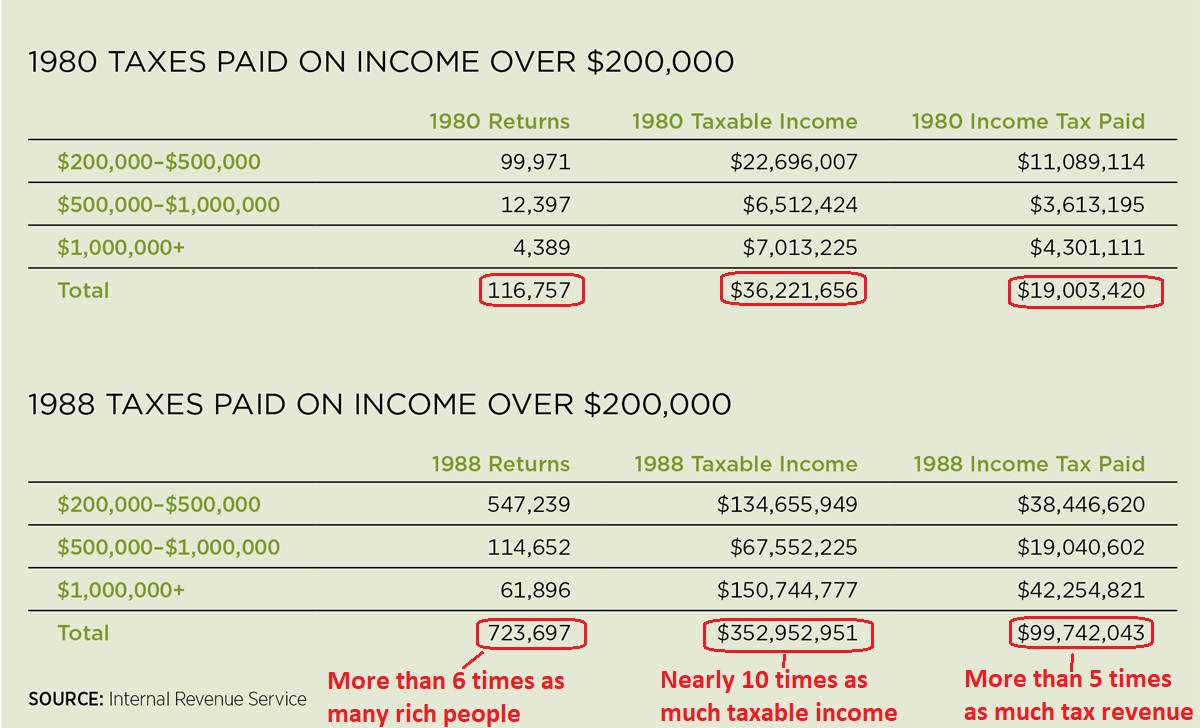
For purposes of today’s column, I’m simply going to share some IRS data on tax revenues in the 1980s. I challenge Mr. Pearlstein (or anyone else) to give their explanation for why the rich paid five times as much tax revenue after Reagan reduced their tax rate from 70 percent to 28 percent.

What happened with rich people in the 1980s is an (admittedly rare) example of lower tax rates producing more revenue.

I’m citing this data not to claim that other tax cuts are self-financing, but instead to provide some evidence that is indisputable even to folks on the left. Suffice to say I’ve been sharing this data for decades and I’ve yet to have anyone provide an alternative explanation for why the rich dramatically increases their tax payments.

P.S. Our friends on the left sometimes have bumper stickers that say “Think globally, act locally.” With that in mind, here are six city-specific examples (here, here, here, here, here, and here) of the Laffer Curve.

Monday, October 7, 2024

Sensible Tax Analysis from British Bureaucrats

October 6, 2024 by Dan Mitchell @ International Liberty, Tags:  , , , , , ,

Part I of my three-part video series on the Laffer Curve is a good introduction to today’s column. It’s a common-sense primer on why there is not a linear relationship between tax rates and tax revenue.


This is not a controversial view. Even Paul Krugman agrees that the Laffer Curve exists.  

The debate is over the shape of the curve. To be more specific, most people argue about the location of the revenue-maximizing point. Is it when the top tax rate is 30 percent? 70 percent? Or where?  

Since I don’t want to maximize revenue for politicians, I’m not overly concerned about that discussion.

But I often try to convince well-meaning leftists that it’s definitely a bad idea to set tax rates so high that governments actually collect less revenue.

That’s not a compelling argument for the leftists who are motivated by spite.

But it does work for others and we’re going to cross the Atlantic Ocean today and look a real-world example involving potential tax increases on “carried interest” and “non-doms.” Here are some excerpts from an article in the U.K.-based Times.


Keir Starmer said in Labour’s manifesto that he would halt arrangements where money made in private equity deals is taxed as a capital gain at 28 per cent rather than at the additional — and highest — 45p income tax rate. Labour said it could raise £560 million for public services by changing the tax system for what is known as “carried interest”, a share of profits from a ­private equity fund. …The Times has been told that internal Treasury analysis found that the policy could have a “net cost to the exchequer” because wealthy individuals could choose to leave the UK rather than pay the money and deter investment. The cost could rise to as much as £350 million a year after five years. …

A government source said: “We are absolutely in the revenue raising maximising space rather than doing things for ideological reasons.” …Rachel Reeves, the chancellor, is also reassessing a key manifesto commitment to crack down on non-dom perks after being warned that her plans might not raise any money. …Andy Haldane, a former chief economist at the Bank of England, had questioned the plan’s effectiveness. “Is this really garnering us any extra tax revenue? …Does that make it more or less likely people will park their money, set up businesses here and therefore generate growth?”

Congratulations to the unnamed bureaucrats who conducted the internal Treasury analysis. I very much doubt that they have any libertarian inclinations, but at least they recognize that taxes impact behavior. Especially for people with a lot of control over the timing, level, and composition of their income.

Maybe they learned from prior experiences (see here, here, and here) that tax increases can backfire?

P.S. If Kamala Harris wins next month, hopefully some of her crazy ideas will be derailed by similarly sensible people in the U.S. Treasury Department.

Thursday, April 11, 2024

Swedish Tax Policy: From Good to Horrible to Bad

April 10, 2024 by Dan Mitchell @ International Liberty

Since I’m currently in Stockholm and just gave a speech about fiscal policy, let’s take a look at Swedish taxation.

Like most western nations, Sweden became a rich nation in the 1800s and early 1900s when taxes were modest and the burden of government was very small.

How small? Government spending consumed less than 10 percent of economic output.

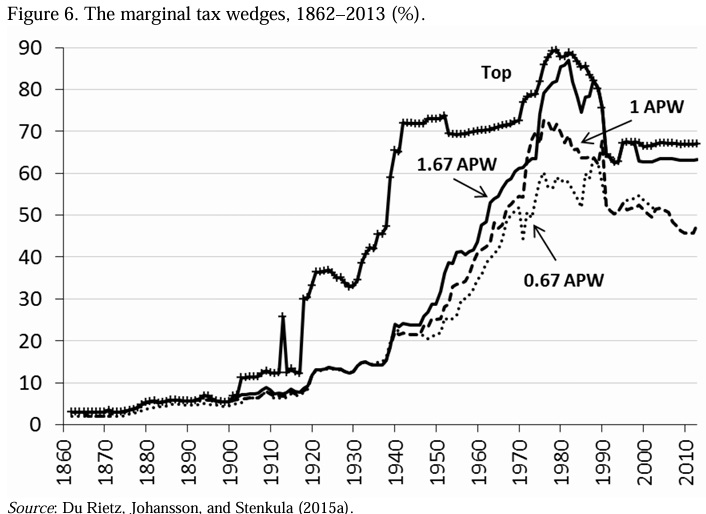
And limited government meant low tax burdens. Here’s a chart from a 2015 report on the history of Swedish taxation. As you can see, even rich people faced marginal tax rates of less than 5 percent in the 1800s and just a bit over 10 percent up until about 1920.

Sadly, tax rates jumped in the 1920s and then skyrocketed in the 1940s. At least for rich people. Close to 90 percent!

But as is so often the case, higher taxes on the rich were a precursor for higher taxes on everyone else. The chart also shows that marginal tax rates for middle income and lower-middle income taxpayers jumped dramatically in the 1950s and 1960s.

By the 1970s and 1980s, everyone was facing confiscatory marginal tax rates.

And don’t forget that Swedish taxpayers also had an onerous value-added tax which grabbed about 20 percent of whatever was left after income and payroll taxes.

That sounds horrible and it was horrible, but the tax burden on investment and entrepreneurship was even worse.

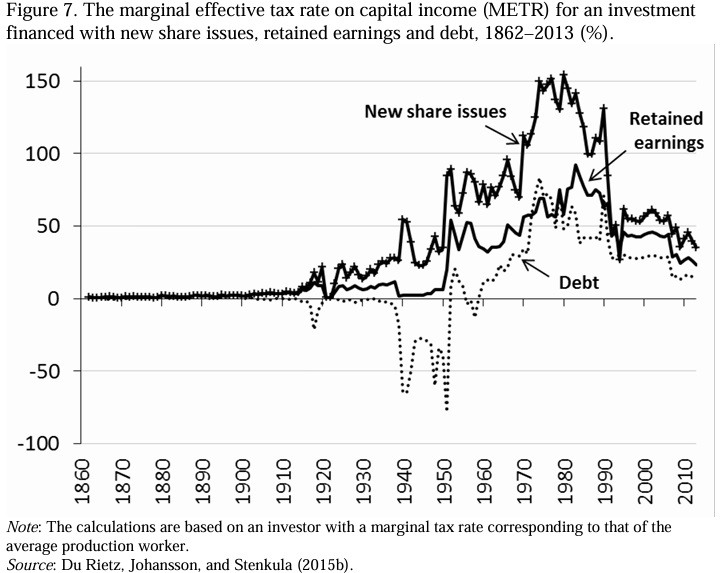
Here’s another chart from the report looking at the effective marginal tax rate on investment.

Before the income tax, there was no problem. And the tax burden was modest during the first half of the 1900s. But look at what happened to tax rates in the 1970s and 1980s. The effective marginal tax rate was way above 100 percent on investments financed with new shares.

In other words, investors would have been better off dumping their money in an incinerator. And the tax rates on other types of investment also peaked about 75 percent-85 percent.

The good news, though, is that Sweden learned from mistakes. Lawmakers began lowering tax rates in the 1980s and especially in the 1990s.

But that simply meant Sweden has gone from horrible tax policy to bad policy. A step in the right direction, to be sure, but marginal tax rates on labor income are still absurdly high

There has been a bigger improvement in business taxation, which is positive, though effective marginal tax rates of 20 percent-35 percent are tolerable rather than good.

But I’ll close with some positive observations. In addition to lowering marginal tax rates, Sweden in recent years also has eliminated both death taxes and wealth taxes.

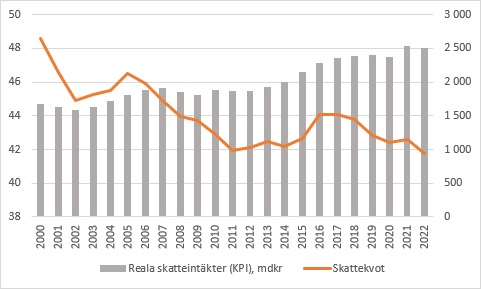
And the overall tax burden has declined.

Interesting, a declining tax burden does not mean declining tax revenue. Here’s a final chart on taxation in the 21st century. The orange line shows the overall tax burden as a share of GDP and the grey bars show inflation-adjusted tax revenue.

It’s almost as if the Laffer Curve is working its magic (and even Paul Krugman might agree). As it has before.

P.S. Sweden has some very admirable policies, such as school choice and a partially privatized Social Security system.

Thursday, February 15, 2024

The Laffer Curve’s Latest Victim: California

February 13, 2024 by Dan Mitchell @ International Liberty

The Laffer Curve is the common-sense notion that people respond to incentives.

And even Paul Krugman admits this has implications for tax revenue.

For instance, if tax rates increase, people may decide to earn and/or report less taxable income. When that happens, revenue won’t increase by as much as politicians hope.

And the reverse is true (in some cases, dramatically true) if tax rates decrease.

For today’s column, let’s look at a real-world example of the Laffer Curve.

Joshua Rauh of Stanford and Ryan Shyu of Amazon have new research that looks at what happened after California voters approved a big class-warfare tax increase in 2012.

Here are some excerpts from their study.


In this paper we study the question of the elasticity of the tax base with respect to taxation…on the universe of California taxpayers around the implementation of major 2012 ballot initiative, Proposition 30. …The Proposition 30 ballot initiative increased marginal income tax rates…by 3 percentage points for singles with over $500,000 in taxable income (married couples with over $1 million)…, the highest state-level marginal tax rate in the nation. …We…document a substantial onetime outflow of high-earning taxpayers from California in response to Proposition 30. …For those earning over $5 million, the rate of departures spiked from 1.5% after the 2011 tax year to 2.125% after the 2012 tax year, with a similar effect among taxpayers earning $2-5 million in 2012. …California top-earners on average report $522,000 less in taxable income in 2012, $357,000 less in 2013, and $599,000 less in 2014; this is relative to a baseline mean income of $4.15 million amongst our defined group of California top-earners in 2011. Compared to counterfactuals in similarly high-tax states, California top-earners on average report $352,000 less in taxable income in 2012, $373,000 less in 2013, and $481,000 less in 2014.

So some upper-income taxpayers moved and others (unsurprisingly) earned/reported less taxable income.

Did that have an impact on tax revenue?

The answer is yes.

…we assess the implications of our estimates for tax revenue in the context of California Proposition 30. A back of the envelope calculation based on our econometric estimates finds that the intensive and extensive margin responses to taxation combined to undo 45.2% of the revenue gains from taxation that otherwise would have accrued to California in the absence of behavioral responses within the first year and 60.9% within the first two years.

Wow, more than 60 percent of projected revenue evaporated within two years.

By the way, these estimates are based on data only through the middle of last decade. And something significant happened after that: The state and local tax deduction was curtailed as part of the Trump tax package.

The authors speculate that this will have very important implications.

…the “Tax Cuts and Jobs Act” (TCJA). Under this law, the top rate is 37% for single and head-of-household filers earning over $500,000, and for married filers earning over $600,000. Despite this nominal cut to top rates, the legislation on net increased rates on top earners because it capped state and local deductions at $10,000 total. … we use our top line intensive margin elasticity estimate to provide a ballpark quantification of the federal tax revenue implications of TCJA for the particular set of California high earners in our treatment group. …Consider a married California taxpayer earning $4.15 million of wage income. In 2017, this taxpayer pays a federal tax bill of $1,431,305. In 2018, incorporating the 8.6% income decrease, this taxpayer pays a federal tax bill of $1,333,946. This amounts to a 6.8% decrease in tax revenue, putting the TCJA on the wrong side of the Laffer Curve for high-earning individuals in California. … the TCJA increased incentives (in terms of the level of the average tax rate gap) to leave California for zero-tax states by 2.15 times the amount of Proposition 30 for those earning over $5 million, and by a factor of 2.43 for those earning from $2-5 million. Based on these scaling factors, we would predict an out-migration effect of 1.46% of those earning $2-5 million, and 1.51% of those earning $5 million.

None of this should be a surprise.

Indeed, I wrote back in 2012 that bad things would happen when Proposition 30 was approved.

I feel safe in stating that this measure is going to accelerate California’s economic decline. Some successful taxpayers are going to tunnel under the proverbial Berlin Wall and escape to states with better (or less worse) fiscal policy. …It goes without saying, of course, that California’s politicians…will act surprised when revenues fall short of projections because of the Laffer Curve.

To be fair, I don’t know if California politicians are genuinely surprised. I suspect many of them privately understand the adverse consequences of class-warfare tax policy. But they nonetheless support bad policy because they are motivated by a selfish desire to maximize votes.

Wednesday, January 24, 2024

Kenya Crashes on the Laffer Curve

January 23, 2024 by Dan Mitchell @ International Liberty

The Laffer Curve is the common-sense notion that there is not a simplistic mechanical relationship between tax rates and tax revenue.

You also have to consider potential changes to what’s being taxed.

I’ve cited interesting case studies from Canada, Denmark, Hungary, Ireland, Italy, Portugal, Russia, France, and the United Kingdom.

Today we’re going to add Kenya to our list.

But before looking at Kenyan tax policy, let’s first look at some IMF data on the rapidly growing burden of government spending in that East African nation.

That’s a very depressing chart, showing about 10 times as much spending today compared to 20 years ago. But keep in mind that there’s been inflation.

If you look instead at spending as a share of economic output, the government budget is now consuming about 22.5 percent of GDP compared to 15.5 percent of GDP two decades ago.

A very troubling development, though not as bad as implied by the chart.

As is usually the case, bad spending policy has led to bad tax policy. Kenyan politicians have been trying to squeeze more money out of the private sector.

However, as reported by Victor Amadala for the Star, higher taxes are backfiring.


Kenyans…talked to the Star on measures they take to survive in a tough economic environment characterized by the high cost of goods and services due to high taxes… Last year, the government introduced several tax measures in the Finance Act, 2023 that added pressure on taxpayers, pushing up the cost of living. It, for instance, doubled Value Added Tax to 16 percent on fuel… Others are the introduction of a housing levy and raised deductions on national health coverage and social protection. …An analysis of official data by both the Kenya National Bureau of Statistics and the Energy and Petroleum Regulatory Authority (EPRA) shows kerosene consumption dropped by almost half, three months after VAT on fuel doubled in July last year. Only 15.3 million litres of kerosene were sold in the review period compared to 28.8 million litres same period in 2022, the lowest in past five years. …The state is on the receiving end as consumers become creative to escape high taxes. The latest report by the Parliamentary Budget Office (BPO) shows Kenya Revenue Authority (KRA) missed the tax revenue collection target for quarter one of the current financial year by Sh72.5 billion. …”You cannot defy the Laffer Curve theory and survive. Tax measures must be of mutual benefit between the public and the state. This is just the tip of the iceberg, winter is coming,” an economist Shem Mutonji opines. …This sentiment is echoed by his colleague, Joe Ngatia who says you cannot overmilk a cow to prosperity for “It will throw a hoaf in desperation.”

Sounds like we need Shem Mutonji and Joe Ngatia working for the U.S. Treasury. Maybe they could convince Joe Biden that overtaxing the American economy is not a good idea.


Thursday, January 11, 2024

The Prudent Case for the Laffer Curve, Part II

January 9, 2024 by Dan Mitchell @ International Liberty

The Laffer Curve is the common-sense notion that changes in tax rates lead to changes in taxable income.

But, as I explain in this clip from a TV program in Hawaii, that doesn’t mean tax cuts “pay for themselves.”

Before any readers accuse me of being an apologist for class warfare, I’m a strong advocate of the Laffer Curve.

And I’ve cited examples of tax cuts that have produced more revenue.


But most tax cuts are not self-financing. There will almost always be revenue feedback, of course, but the revenue loss from the lower rate generally will be larger than the revenue gain from higher taxable income.

However, that is not an argument against lowering taxes. As I stated in the discussion, it would be a win-win situation if we could convince politicians to lower tax rates and restrain government spending.

Heck, because of the starve-the-beast theory, I’d applaud a revenue-losing tax cut precisely because it would reduce the amount of loot available to politicians.

P.S. I mentioned that Hawaii has a spending cap. That’s the good news. The bad news is that the legislature routinely waives it. To build on an analogy I’ve used before, having a speed limit in a school zone is a good idea, but not if it’s set at 70 MPH. Or, in the case of Hawaii, a speed limit in a school zone is pointless if the cops announce they will never patrol that road.

Monday, October 16, 2023

Ireland’s Corporate Tax and the Laffer Curve

October 15, 2023 by Dan Mitchell @ International Liberty

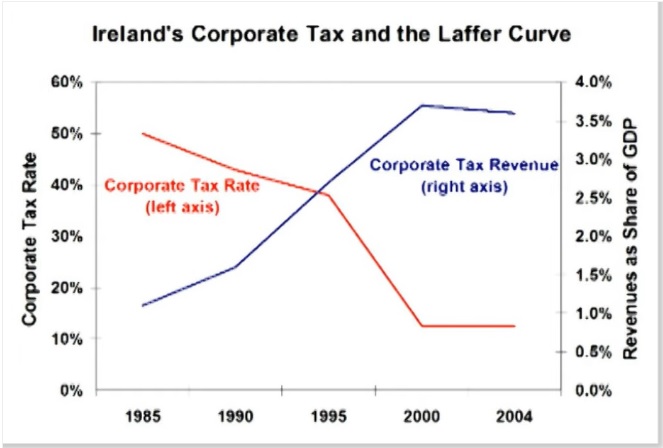
About 15 years ago, I narrated a three-part series on the Laffer Curve. Here’s Part II, which looks at real-world evidence.

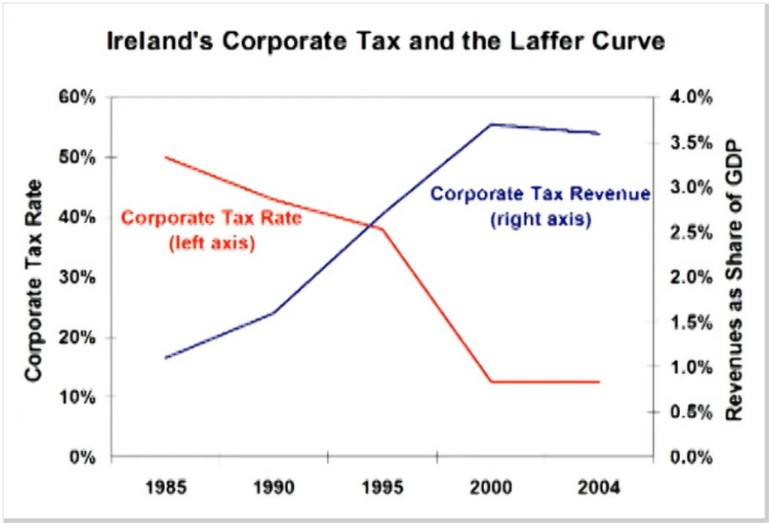
About halfway through the video (3:15-3:55), I discuss what happened when Ireland dramatically lowered its corporate tax rate.


The net result was an increase in tax revenue.

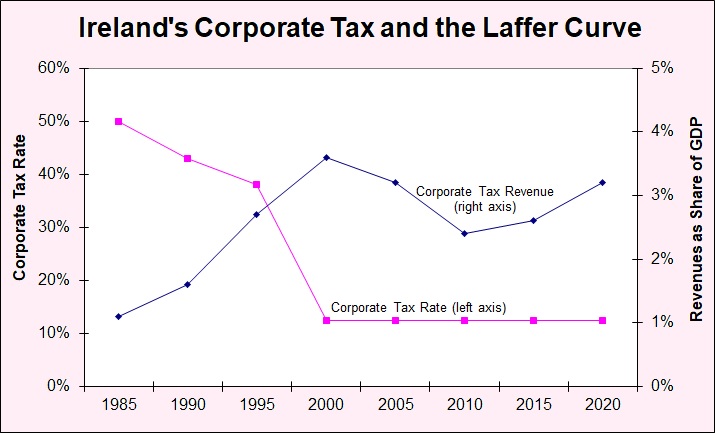
But not just by a small amount. I included a chart showing that corporate tax revenue as a share of GDP significantly increased in response to the lower rate.

And I made sure to point out that economic output also increased dramatically, meaning that the Irish government not only got a bigger slice of the pie, but also that the pie was much larger.

I’ve been asked a few times, however, whether that was a transitory phenomenon.

The answer is no. Using OECD data, I’ve updated the chart to also show what’s happened in the past 15 years. As you can see, corporate tax revenue has averaged close to 3 percent of economic output.

I realize that some folks on the left will be skeptical, even though I’m using data from the left-leaning OECD.

But perhaps they’ll believe the New York Times.

Ed O’Loughlin reports that Irish corporate tax revenues are so buoyant that the government in battling over how to allocate a budget surplus.

Ireland …is discovering that having too much money can…be a problem. Swollen by rising corporate tax revenue, mainly from American tech and pharmaceutical corporations, the government is expecting to have a record budget surplus of 10 billion euros ($10.9 billion) this year. Next year, the windfall is projected to be even larger, reaching €16 billion. For years, Ireland’s low corporate tax rate has lured multinational organizations to set up overseas subsidiaries here. Their tax payments have created a financial cushion for the government… Which leaves Irish lawmakers in a quandary. As the government prepares its annual budget statement in October, it must settle the tricky question of what to do with this pot of money. Chief among the options: save it for the future; pay off debts; invest in badly needed housing or some other infrastructure, like hospitals, schools and a subway system for Dublin; or give it away in tax cuts and support payments.

For what it’s worth, the obvious answer is lower tax rates on households (an area where Ireland scores very poorly).

Spending increases, by contrast, would be a very bad idea, especially since that approach has backfired in the past.

I’ll close with a final observation that Ireland is a success story, but GDP data create an excessively optimistic picture.

P.S. The NYT article also points out that big-ticket infrastructure projects suffer from massive cost overruns (sound familiar?).

…one obstacle to spending money on major projects, said Eoin Reeves, an economics professor at the University of Limerick, is that the Irish government has not been efficient at spending large sums of money on big investments. …Even by global standards, big infrastructure projects in Ireland tend to be completed late and far over budget. In 2015, a new 380-bed national children’s hospital in Dublin was projected to open by 2020, at a cost of €650 million. Its opening date has now been postponed until next year and at a cost of almost €2.2 billion — which reportedly could make it the most expensive hospital in the world, in terms of cost per bed. …plans for a line to its busy airport, with an estimated price tag in 2000 of €3.5 billion, have been repeatedly postponed or modified. The latest plan, if it ever gets underway, would take about 10 years to construct, at a cost of €7 billion to €12 billion.

P.P.S. The article also notes that the OECD’s global minimum tax scheme will hurt Ireland.

…the Organization for Economic Cooperation and Development is leading an effort to create a global minimum corporate tax rate of 15 percent, which could flatten Ireland’s tax-rate advantage.

It is true that Ireland will become less competitive, but there are many other losers when governments conspire against taxpayers.

P.P.P.S. Ireland was a role model of spending restraint in the late 1980s.

Friday, December 2, 2022

The IMF, the Laffer Curve, and Supply-Side Economics

November 3, 2022 by Dan Mitchell @ International Liberty

The Laffer Curve is a very straightforward concept.

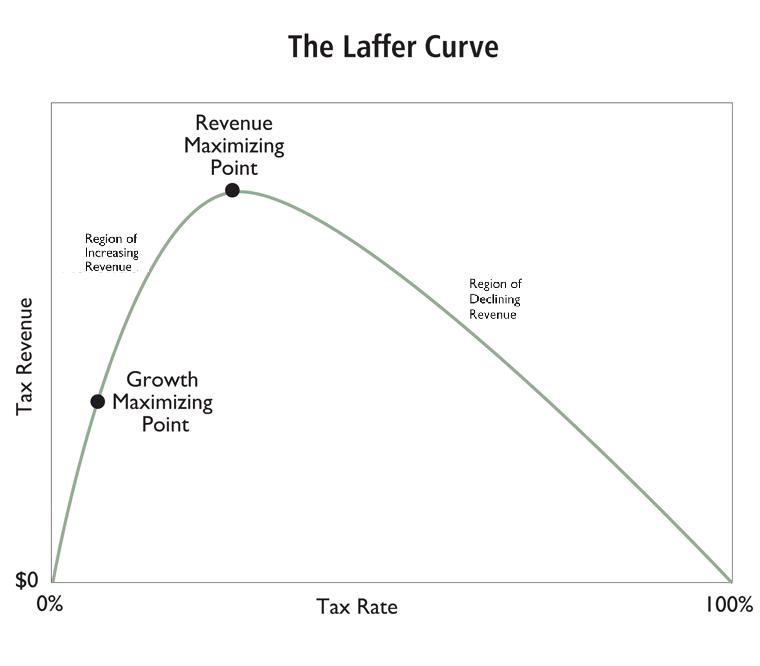
It graphically illustrates why politicians are wrong if they think you can double tax revenue by doubling tax rates (or that revenues will drop by 50 percent if tax rates are cut in half). Simply stated, you also have to look at what happens to taxable income.

 https://danieljmitchell.files.wordpress.com/2012/07/laffer-curve.jpg

In cases where taxpayers have a lot of control over the timing, level, and composition of their income, changes in tax rates may cause big changes in taxable income (or “tax base” in the jargon of economists).

None of this should be controversial. Even Paul Krugman agrees that the Laffer Curve exists.

Today, we are going to see that the pro-tax International Monetary Fund also admits there is a Laffer Curve.

Indeed, a new study authored by David Amaglobeli, Valerio Crispolti, and Xuguang Simon Sheng openly states that politicians should be very cognizant of the fact that some tax policy changes can have a big effect on the “tax base.”


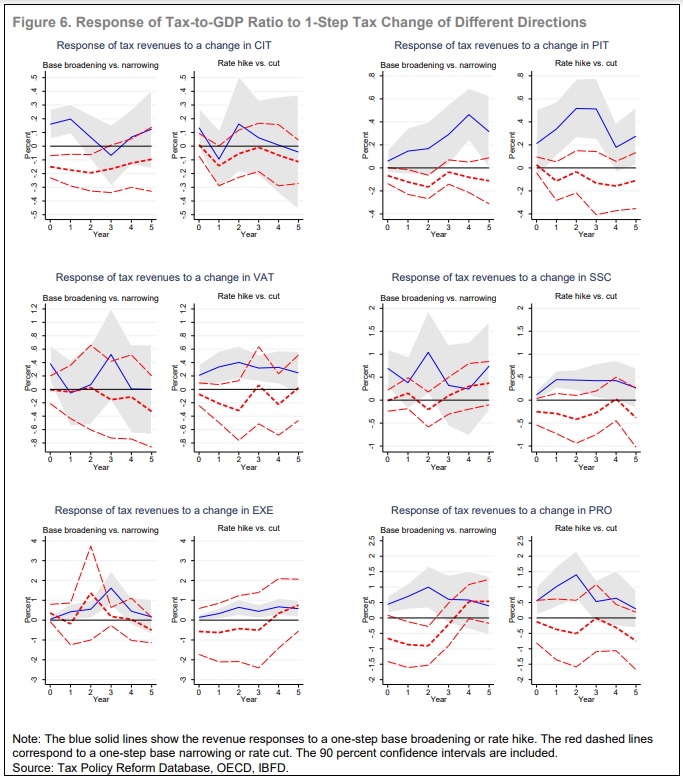
This paper investigates the potential revenue impact of different tax policy changes using the Tax Policy Reform Database (TPRD)… Revenue responses to tax policy changes depend on many factors… However, one of most important factors is the nature of the tax policy change itself. For example, while a tax rate cut will directly lower revenue intake, it could also encourage more economic activity, hence expand the tax base. Estimating the revenue response to a tax policy change, therefore, requires granular information on the nature of this change, including on the tax instrument used (e.g., VAT or personal income tax), the type of change adopted (e.g., tax base, tax rate), and its timing and size.

Here are some of the findings.

We assess the impact of tax policy changes on tax revenues using Jordà (2005)’s local projections method. Our baseline results are based on tax shocks identified in the year when a tax change is announced. Our main empirical findings suggest that the revenue yield of tax policy changes varies significantly across taxes and types of changes, with tax rate changes generally having a more transitory revenue impact than tax base changes for most taxes. Specifically, base broadening changes in PIT, CIT, EXE, and PRO have on average a more significant and long-lasting impact on tax collection than rate changes. At the same time, rate hikes have relatively more significant effects on taxes in the case of VAT and SSC measures.

Most notably, the report finds tax increases hurt prosperity, especially higher marginal tax rates.

Gechert and Groß (2019) conclude that measures to broaden the tax base are less harmful to economic growth than tax hikes. Dabla-Norris and Lima (2018) find that during fiscal consolidations, tax base-broadening measures lead to smaller output and employment declines compared to measures to increase tax rates.

And we learn that it is very foolish to raise corporate tax rates.

Mertens and Ravn (2013) find that…increases in CIT are approximately revenue neutral for the United States. …Announcements of CIT increases are associated with a somewhat transitory rise in tax collection, suggesting that companies have quickly adapted their business to reduce the tax burden.

For wonky readers, here’s a chart from the study. Note how, in many cases, there’s not much difference in revenue between tax increases (blue line) and tax cuts (red lines).

P.S. One big takeaway is that there is not a single Laffer Curve. There are multiple Laffer Curves depending on the tax that’s being changed and the ability of taxpayers to change their behavior.

P.P.S. A less-obvious takeaway is that class-warfare taxes cause the most economic damage, meaning the most harm to ordinary people.

P.P.P.S. You can call it the “Khaldun Curve” if you prefer.

P.P.P.P.S. I have trouble deciding what evidence is most powerful, the views of CPAs or the data from the OECD?


Monday, November 28, 2022

Corporate Tax Rates and Taxable Income

In the case of business taxation, the most visually powerful evidence for the Laffer Curve is what happened to corporate tax revenue in Ireland after the corporate tax rate was slashed from 50 percent to 12.5 percent.


Tax revenue increased dramatically. Not just in nominal terms. Not just in inflation-adjusted terms.

Corporate receipts actually climbed as a share of GDP.

And this was during the decades when economic output was rapidly expanding.

In other words, the Irish government got a much bigger slice of a much bigger pie after tax rates were dramatically lowered.

Now let’s look at some evidence from a new study. Three professors from the University of Utah (Jeffrey Coles, Elena Patel, and Nather Seegert), and a Treasury Department economist (Matthew Smith) estimated what happens to taxable income for U.S. companies when there is a change in the corporate tax rate.

In response to a 10% increase in the expected marginal tax rate, private U.S. firms decrease taxable income by 9.1%, which indicates a discernibly more elastic response than prevailing estimates. This response reflects a decrease in taxable income of 3.0% arising from real economic responses to a firm’s scale of operations and 6.1% arising from accounting transactions via (for example) revenue and expense timing. Responsiveness to the corporate tax rate is more elastic if a firm uses cash (9.9%) rather than accrual accounting (7.4%), if the firm is small (9.9%) rather than large (8.6%), and if the firm discounts future cash flows at a lower rate.

The paper is filled with equation, graphs, and jargon, but the above excerpt tells us everything we need to know.

When tax rates go up, taxable income goes down (both because there is less economic activity and because companies have more incentive to manipulate the tax code).

Thus confirming what I wrote back in 2016 about taxable income being the key variable.

By the way, this does not mean that lower tax rates lead to more revenue. Or that higher tax rate produce less revenue.

Such big swings only happen in rare circumstances.

But it does mean that politicians will not grab as much money as they hope when they increase tax rates. And that they won’t lose as much revenue as they fear when they lower tax rates (and we saw that most recently with the 2017 tax reform).

I’ll close by noting that this is additional evidence for why we should be thankful that Biden’s proposal for higher corporate tax rates was not enacted.

P.S. The chart at the beginning of this column may be the most visually powerful evidence for the corporate Laffer Curve. The most empirically powerful evidence, however, comes from very unlikely sources – the pro-tax IMF and the pro-tax OECD.


Sunday, February 27, 2022

Dan Mitchell on the Laffer Curve and Health Care

Deconstructing the Laffer Curve(s)  

February 12, 2022 by Dan Mitchell

 The Laffer Curve is a method for illustrating the relationship between tax rates, taxable income, and tax revenue.


But it’s important to realize that there are actually lots of varieties. The Laffer Curve for capital gains taxes, for instance, will look different than the Laffer Curve for payroll taxes. Or corporate taxes. Or marijuana taxes. In every case, the shape of the curve will depend on what’s being taxed and the ability of affected taxpayers to alter their behavior. And the shape of the Laffer Curve also will depend on whether one is measuring the short-run revenue impact of tax changes or the long-run impact of tax changes.  Given all these varieties, no wonder so many people, both right and left, sometimes misstate its meaning.

Let’s try to expand our understanding of the Lafffer Curve by looking at some new research.........To Read More....

The health care system in the United States is expensive and inefficient, and both of those problems are caused by government.

\More specifically, politicians have enacted laws (everything from the tax code’s exclusion of fringe benefits to programs such as Medicare and Medicaid) that have produced a system overwhelmingly based on third-party payer. And with so many people using (what they perceive to be) other people’s money to buy healthcare, we shouldn’t be surprised to see perverse results. In a genuine free market, buyers and sellers directly interact. Both sides of the transaction have an incentive to get the best-possible outcome, and this process promotes efficiency and low prices.


In America’s healthcare system, however, government policies have saddled us with intermediaries that weaken, distort, or even eliminate normal market forces. Which explains high costs and inefficiency, which is how we began this column.

To understand why third-party payer plays such a pernicious role, let’s look at a column that Dr. Ryan Neuhofel wrote for the Foundation for Economic Education. He imagines a world where we buy food at the grocery store the same way we currently buy healthcare.........To Read More.....


Thursday, October 14, 2021

The Laffer Curve and Trump’s 21 Percent Corporate Tax Rate

Reducing the corporate tax rate from 35 percent to 21 percent was the crown jewel of Trump’s 2017 Tax Cut and Jobs Act (TCJA).

  • It was good for workers since a lower rate means more investment, which translates to increased productivity and higher wages.
  • And it was good for U.S. competitiveness since the United States corporate tax rate no longer was the highest in the developed world.

Some critics downplayed those benefits and warned that a lower corporate tax rate would deprive the government of too much revenue.

Since I don’t want politicians to have more money, that was not a persuasive argument. Moreover, I argued during the debate in 2017 that a lower corporate tax rate would generate “revenue feedback.”

In other words, there would be a “Laffer Curve” effect as corporations responded to a lower tax rate by earning and reporting more income.

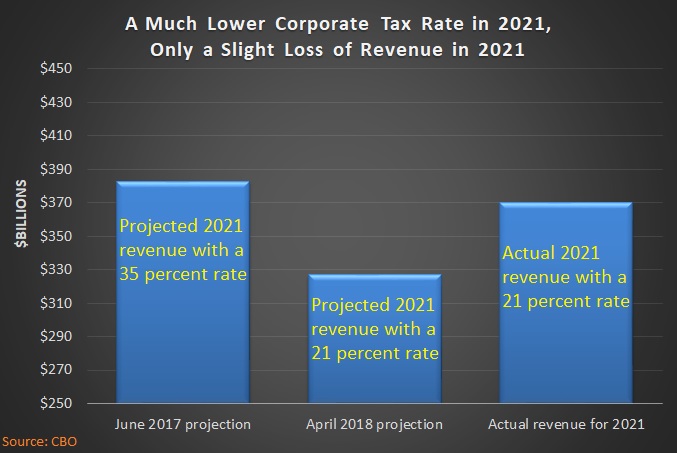
Based on the latest fiscal data from the Congressional Budget Office (CBO), I was right.

Corporate tax revenues for the 2021 fiscal year (which ended on September 30) were $370 billion. As shown in this chart, that’s only slightly below CBO’s estimate back in 2017 of how much revenue would be collected – $383 billion – if the rate stayed at 35 percent.

The chart also shows CBO’s 2018 estimate of what revenues would be in 2021 with a 21 percent rate (and if you want more data, the Joint Committee on Taxation estimated that the Trump tax reform would reduce corporate revenues in 2021 by $131 billion).

This leads me to ask two questions.

  1. Is this a slam-dunk argument for the Laffer Curve?
  2. Did the lower corporate tax revenue generate so much revenue feedback that it was almost self-financing?

The answer to the first question almost certainly is “yes” but “don’t exaggerate” is probably the prudent response to the second question.

Here are a few reasons to be cautious about making bold assertions.

  • CBO’s pre-TCJA estimate in 2017 may have been wrong for reasons that have nothing to do with the tax rate.
  • CBO’s post-TCJA estimate in 2018 may have been wrong for reasons that have nothing to do with the tax rate.
  • The surge of 2021 revenues may have been a one-time blip that will disappear or fade in the next few years.
  • The coronoavirus pandemic, or the policy response from Washington, may be distorting the numbers.

These are all legitimate caveats, so presumably it would be an exaggeration to simply look at the above chart and claim Trump’s reduction in the corporate tax rate almost “paid for itself.”

But we can look at the chart and state that there was a lot of revenue feedback, which shows that the lower corporate tax rate did produce good economic results.

Perhaps most important, we now have more evidence that Biden’s plan to increase the corporate tax rate is very misguided. Yes, it’s possible that the President’s plan may generate a bit of additional tax revenue, but at a very steep cost for workers, consumers, and shareholders.

P.S. If you want an example of tax cut that was self-financing, check out the IRS data on how much the rich paid before and after the Reagan tax cuts.

Monday, August 17, 2020

A Primer on the Laffer Curve

August 13, 2020 by Dan Mitchell

Last week, I gave a presentation on the Laffer Curve to a seminar organized by the New Economic School in the nation of Georgia.  A major goal was to help students understand that you can’t figure out how changes in tax rates affect tax revenues without also figuring out how changes in tax rates affect taxable income.


As you might expect, I showed the students a visual depiction of the Laffer Curve, explaining that the government won’t collect any revenue if the tax rate is zero (the left point of the horizontal axis), but also pointing out that the government won’t collect any revenue if tax rates are 100 percent (the right point on the horizontal axis). The curve between those two points shows how much tax is collected at various tax rates. The upward-sloping part of the curve shows the “region of increasing revenue” (i.e., where higher tax rates produce more revenue) and the downward-sloping part of the curve shows the “region of declining revenue” (i.e., where higher tax rates produce less revenue). I noted in my remarks that this is not a controversial concept. Indeed, I’d wager that every economist in the world will agree. Just in case you think I’m exaggerating, you can see in this video that even Paul Krugman agrees that there is a Laffer Curve...........To Read More....

Thursday, April 23, 2020

Art Laffer's Inside Track to Trump's Economic Recovery Team

By Susan Crabtree - RCP Staff

It took three phone calls the night of March 19 before President Trump reached Arthur Laffer, the renowned economist whose career has spanned five decades, nine presidents and at least four major economic crises, including the current coronavirus-induced freefall.

At that time last month, the world was still coming to grips with COVID-19’s grim toll. Some 500 people died in Italy that day, the deadliest toll thus far, and the Trump administration had unveiled a $1 trillion relief plan to try to stabilize the cratering economy.............. While he supports the $4 trillion in Federal Reserve loans to businesses crushed by COVID-forced worker lock-downs, he doesn’t believe the U.S. government should be bailing out big businesses with their own prior financial troubles, such as Boeing and American Airlines.

“Why should we bail out their investors and debtors – why should we lend money to losing companies? Let them re-structure and come back out swinging,” he told RCP. “It’s the same company — it’s only different owners. American Airlines – they go through bankruptcy every 10 years, and they’re still American Airlines. When people say you can’t let Boeing go under, I say, what the hell? The building’s gonna be there, all the people are gonna be there. It’s just going to be different owners.”

Laffer’s even less charitable when it comes to Mnuchin’s push to have the U.S. government hold an equity stake in airlines and other businesses: “That’s really what you want now? We can become Venezuela – whoooaaa!”  .............Council to Reopen America,.............Laffer was not among the names being circulated for the task force ..........“Whenever people make decisions when they are either panicked or drunk, the consequences are really rarely attractive,” he said. “And right now Washington is in a panic.”............“Arthur is not a fair-weather friend – he’s the opposite,” Forbes adds.............

As both parties look to bigger government solutions for the economy, Laffer says he hopes Trump continues to make his own executive decisions on re-opening the economy after carefully weighing the advice of health experts and economic advisers.

“Trump’s been, I think, a wonderful president, and just hope he doesn’t get misled,” he says. “And I’m going to do all I can to make sure he isn’t.”............To Read More....