Search This Blog

De Omnibus Dubitandum - Lux Veritas

Showing posts with label Poverty. Show all posts

Monday, June 9, 2025

Columnist at the Washington Post Lies About Poverty…Again

June 8, 2025 by Dan Mitchell @ International Liberty

I have a special page called Poverty Hucksters, which features people or institutions (such as the Obama Administration, Steven Greenhouse, and the United Nations) that have deliberately lied about poverty.

No person has ever been featured more than one time, but that changes today because Eduardo Porter outed himself as a poverty huckster while at the New York Times back in 2018.

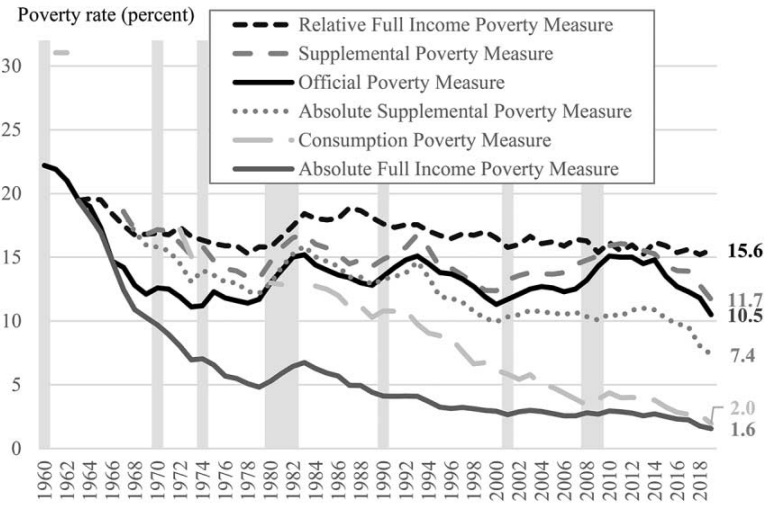
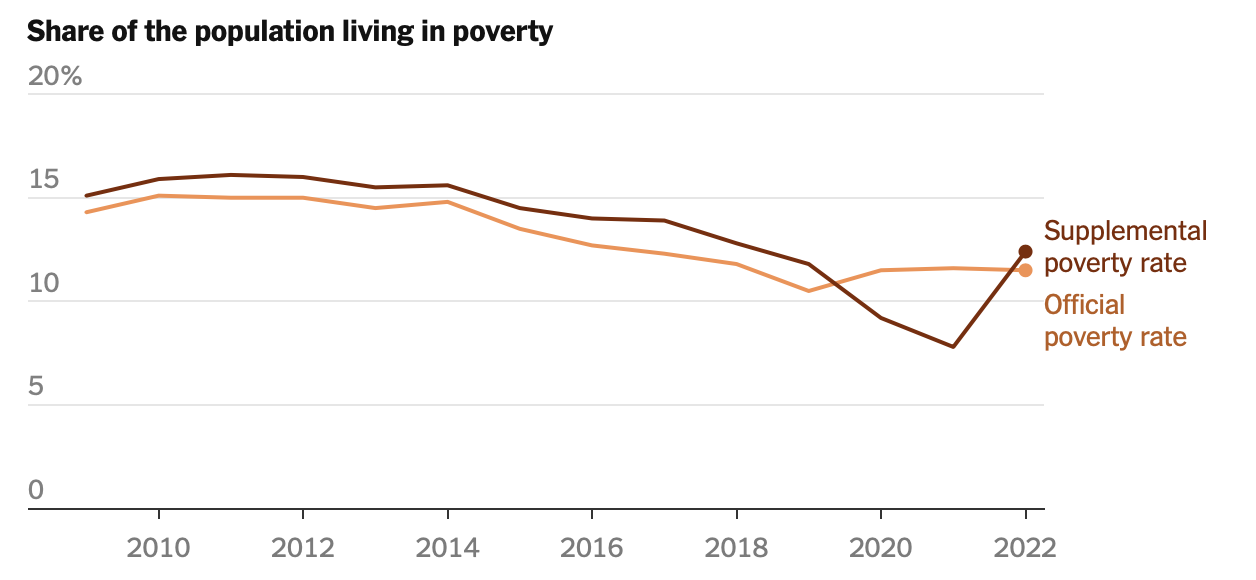
Now, he’s done it again. Here’s a chart from his recent column in the Washington Post, augmented by my question about whether his numbers are accurate.

Simply stated, Porter’s chart is dishonest nonsense because it is not measuring poverty.

I’m not joking. If you read the fine print, what the chart really shows is the percentage of the population with less than half the median income.

Yet this conveniently ignores an all-important issue, which is whether a nation has a high median income (like the United States) or a low median income (like some of the nations in the chart that supposedly have much less poverty).

I debunked this dodgy methodology back in 2017.

…it’s total nonsense. …it’s a measure of income distribution. …Think about what this means. A country where everyone is impoverished will have zero or close-to-zero poverty because everyone is at the median income. But as I’ve explained before, a very wealthy society can have lots of “poverty” if some people are a lot richer than others. And since the United States is much richer than other nations, this means an American household with $35,000 of income can be poor, even though they wouldn’t count as poor if they earned that much elsewhere.

And here’s some of what I wrote in 2019.

It is indeed strange that so many folks on the left have decided to use an artificial and misleading definition of poverty. One that depends on the distribution of income rather than any specific measure of poverty. Which is insanely dishonest. It means that everyone’s income could double and the supposed rate of poverty would stay the same. Or a country could execute all the rich people and the alleged rate of poverty would decline.

Here’s a chart I shared back in 2020.

It shows that poor people in the United States would be middle class (or above!) in many European countries.

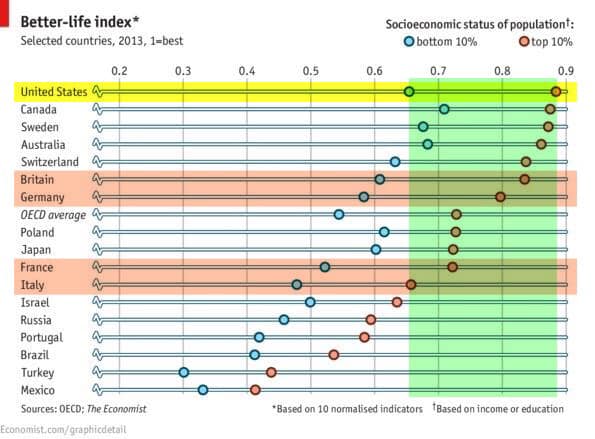
And since the U.S. has been growing much faster than Europe in recent years, an updated version of this chart would be even more dramatic.

I want to close by pointing out some remarkable, but surely accidental, passages from Porter’s column.

He openly admits America is far richer than most other developed nations

The United States is by many measures the most powerful, prosperous nation on earth, sitting on the frontier of innovation and consistently outpacing its peers in terms of economic growth over recent decades. …despite being poorer and further from the technological frontier, America’s social-democratic peers…spend more effort and taxpayer money… This raises the question: What’s the point of being the most powerful, affluent nation on earth?

Yet instead of arguing for other nations to be more like the United States (lower taxes, smaller welfare state, etc), the whole point of his column is to argue that America should copy the countries that have lower levels of income.

Amazing. And this isn’t the first time he’s urged a successful nation to copy less-successful countries.

One final point: It’s possible that Porter is not being explicitly dishonest in his column. He may have blindly looked at OECD numbers and simply regurgitated them, without bothering to look at the methodology.

P.S. Speaking of the OECD, any analysis of dishonest poverty data should include criticism of the Paris-based Organization for Economic Cooperation and Development. That international bureaucracy is infamous for generating the dodgy data (see here, here, here, and here) that get cited by people like Porter.

Thursday, March 27, 2025

Economic Freedom and Broadly Shared Prosperity

March 19, 2025 by Dan Mitchell @ International Liberty

In 2014, I dug through Census Bureau data to show that the well being of all income groups is closely correlated.

More specifically, the incomes of all five quintiles (from the poorest 20 percent up to the richest 20 percent) tend to rise and fall together.

My takeaway was that President Kennedy was right. A rising tide does lift all boats. I wrote, “If you want policies that help the poor, those also will be policies that help the middle class and rich.”

In other words, policymakers should focus on growth rather than inequality or redistribution.

I then gave some advice to my leftist friends, writing that, “if you hate the rich, you need to realize that policies hurting them will almost certainly hurt the less fortunate as well.”

Now let’s investigate whether this is true in other nations as well. Let’s start by looking at two charts showing that income levels for both the bottom 10 percent and top 10 percent are higher when there is more economic freedom.

These figures seem compelling, but we also know that correlation is not causation (after all, crowing roosters don’t cause the sun to rise).

Fortunately, we have an answer. The above figures come from some academic research by Justin Callais and Andrew Young. In a 2023 article published by the Journal of Comparative Economics, they use statistical analysis to determine whether there is a link between economic liberty and income levels.

Here are some of the findings.

Does a rising tide of economic freedom lift the boats of a country’s poor, middle class, and wealthy? Or – as most commonly is alternatively hypothesized – does greater economic freedom favor the wealthy at the expense of the rest? …In this paper we employ matching methods to address…concerns. …We study changes in economic freedom and their relationship to inequality using 117 countries from 1970 up through 2015. We examine income deciles (both population shares and average levels) as well as Gini coefficients. By employing matching methods, we work to mitigate endogeneity and nonlinearity concerns. …We use logs of the income levels so that the outcome…can be interpreted as a growth rate. The results are reported in table 5. Each of our 36 estimates are positive and statistically significant. …The picture it paints is one of economic freedom as a rising tide that lifts all boats. …the results here are consistent with an increase in economic freedom causing positive income growth, and growth that is not discernably different across income deciles. …it is difficult to argue that the modest increases in income inequality negate the broad-based gains to individuals generally.

For wonky readers, here is the aforementioned Table 5.

I think this evidence is compelling.

And it matches other research I’ve shared in recent years.

But I’m not overly optimistic that some folks on the left will change their minds. As captured by my Eighth Theorem of Government, many of them are not primarily interested in helping the poor.

Indeed, I fear some of them (including at the IMF) are motivated primarily by resentment and spite for the rich. Indeed, they might even be willing to hurt poor people if they knew the rich would be hurt even more.

Margaret Thatcher was right!

Wednesday, May 1, 2024

A New Member of the Poverty Huckster Club

May 1, 2024 by Dan Mitchell @ International Liberty

Genuine material deprivation is almost nonexistent in rich nations such as the United States. This is a huge improvement compared to how people lived just 100 or 20o years ago.  Yet public policy fights about poverty will probably never end for the simple reason that people have different goals.


The cartoon is a good illustration of the first question.  And my Eighth Theorem of Government summarizes the second question. To elaborate on the second question, some of our friends on the left have blurred the distinction between poverty and inequality.  Let’s look at some excerpts from a Project Syndicate article by Teresa Ghilarducci of the New School for Social Research.


America’s retirement system isn’t working. It is failing older workers, pensioners, and would-be retirees, and if we don’t fix it soon, it will also fail future generations, lowering living standards and increasing the risk of poverty. …

Already, America’s elderly suffer a far higher rate of poverty – defined as half the median income or lower – than their peers in other high-income countries. …the old-age poverty rate in the US is 23%, compared to about 15% in the United Kingdom, 12% in Canada, 4.4% in France, and just 3.1% in the Netherlands.

Since there are massive problems with Social Security, I agree with Ms. Ghilarducci that America’s retirement system isn’t working.  But her numbers on old-age poverty seem very strange. How can the poverty rate be much higher in the United States when the other countries she mentions have much lower living standards?


Notice, though, that she wrote that poverty is “defined as half the median income or lower.”

So if you were a millionaire and lived in a house with Jeff Bezos, Elon Musk, and Bill Gates, you would be poor based on this definition. Needless to say, that’s crazy. Poverty should be a concrete number. And it usually is. The World Bank (which is concerned about genuine material deprivation) measures poverty based on whether people are subsisting at very low levels, such as $1.90 per day. In the United States, the poverty rate is a specific calculation of what a household needs to subsist at a modest level.

Ms. Ghilarducci’s numbers, however, come from the left-leaning bureaucrats at the Paris-based Organization for Economic Cooperation and Development. And they have a make-believe measure of poverty based on the distribution of income.  I’m not joking, if you go to their website, you will find these crazy numbers.

  • There’s supposedly more old-age poverty in the United States than there is in countries such as Costa Rica, Greece, Italy, Poland, and Turkey.
  • There’s supposedly more overall poverty in the United States than there is in countries such as Hungary, Mexico, Portugal, Slovenia, and Turkey.

These are garbage numbers, at least for the purpose of measuring poverty. The average senior (or average person) in the United States is much better off than their counterparts in other countries.  So congratulations to Ms. Ghilarducci, who is now a member of the Poverty Hucksters Club.

P.S. In fairness to Ms. Ghilarducci, her article does make some good points about overall retirement policy. I’m sure we disagree on many things, but she favorably cites nations with private Social Security systems, such as Denmark and the Netherlands.

Sunday, January 14, 2024

The Right and Wrong Way to Reduce Poverty, Part I

January 13, 2024 by Dan Mitchell @ International Liberty

I’ve previously pointed out that the so-called War on Poverty is a failure, both for poor people and for taxpayers.

My main argument is that poverty was steadily declining throughout American history, but that progress ground to a halt once politicians in Washington decided to spend trillions of dollars.

As you might expect, folks on the left have a different perspective. Or, to be more precise, they have two different perspectives.

  1. Some left-leaning people assert that that the post-1965 lack of progress is evidence that we need to have even more redistribution.
  2. But some of them instead assert that there has been a lot of progress, but not the kind that shows up in the official measure of poverty.

Today, let’s examine the second argument.

We’ll start with a chart showing many different ways to measure poverty.

The official poverty rate (“Official Poverty Measure”) comes from the Census Bureau and it gets the most attention in the media and elsewhere.

But is it the right measure, and does it show the impact of redistribution programs?

In a study published by the Journal of Political Economy, Richard V. BurkhauserKevin CorinthJames Elwell, and Jeff Larrimore put together a “full poverty measure” that captures the value of various handouts.

Based on their approach, there is almost no material deprivation in the United States. Their poverty rate as of 2019, shown in the above chart, was just 1.6 percent.

Here’s some of what they wrote.


Almost 60 years have passed since President Johnson declared his War on Poverty. Even so, academics and policy makers still debate its outcome. …disagreement over progress in the War on Poverty stems from disagreements over how poverty should be defined… We…create a poverty measure…which we refer to as the absolute full-income poverty measure (FPM)…

We include both cash and in-kind programs designed to fight poverty, including food stamps (now the Supplemental Nutrition Assistance Program [SNAP]), the school lunch program, housing assistance, and health insurance. Finally, we hold poverty thresholds constant in inflation-adjusted terms using the Personal Consumption Expenditures (PCE) price index. Using this poverty measure, we find substantial reductions in poverty based on President Johnson’s standards. Specifically, we find that the absolute FPM poverty rate in 2019 was 1.6%, well below the official poverty rate of 10.5%.

Incidentally, the official poverty rate is now 11.5, so perhaps the authors’ FPM measure also has increased a bit.

But that’s not important for our discussion today. Instead, let’s consider whether their FPM measure shows that the War on Poverty has been a success.

The answer depends, at least in part, of whether you think government dependency is an acceptable outcome.

Here are some further excerpts from the study.

…we evaluate the extent to which poverty has fallen as a result of increases in market income versus increases in government transfers. As President Johnson further stated in his State of the Union address on January 8, 1964, “The War on Poverty is not a struggle simply to support people, to make them dependent on the generosity of others”…

Contrary to this goal of President Johnson, we estimate that dependence—which we define as receiving less than half of full-income from market sources—among working-age individuals increased from 4.7% to 11.0% between 1967 and 2019. Likewise, dependence among children increased from 6.0% to 13.1%. …Success in reducing material hardship has come at the cost of having a greater share of the population dependent on government for at least half of their incomes.

Here are some charts from the JPE article, all of them showing how dependency increased for just about all groups in society.

Here’s one final excerpt, showing the difference between the right way and wrong way of reducing poverty.

…the War on Poverty…was not won by making people more self-sufficient, as President Johnson sought. Dependence (defined as receiving less than half of household income from market sources) among working-age adults and children more than doubled from 1967 to 2019. However, the rise in dependence was not uniform over the entire period, with dependence falling substantially, especially among children and non-aged Black individuals, from 1993 to 2000. This period is coincident with welfare reforms that required and encouraged work as well as a strong labor market.

This echoes my view that Bill Clinton’s welfare reform (replacing an entitlement with a block grant) was very successful and that it should be extended to other redistribution programs such as Medicaid and food stamps.

And it reinforces my view that Biden’s proposal for per-child handouts would be very harmful. The goal should be employment and self-sufficiency, not dependency and bigger government.

P.S. We can learn lessons about welfare and dependency by looking at data from Europe and Canada.


Thursday, November 16, 2023

Why Mr. Beast Is Under Fire for Bringing Clean Water to 500,000 Africans

Jon Miltimore November 15, 2023 @ American Institute for Economic Research

James Stephen “Jimmy” Donaldson, better known by his professional moniker “Mr. Beast,” has made a name for himself — and hundreds of millions of dollars for humanitarian causes — by leveraging his social media platform. 

He’s cleaned up our oceans, planted 20 million trees, and fought hunger by feeding needy people in communities across the US. In his latest effort, Mr. Beast built 100 wells in Africa, bringing clean drinking water to an estimated 500,000 people in countries from Kenya to Cameroon to Zimbabwe.

Not everyone is happy with Mr. Beast’s latest campaign, however, or his broader philanthropic efforts. 

One Kenyan politician told CNN Mr. Beast’s well campaign fed the perception that African countries are “dependent on handouts,” while the founder of a charity complained that “a white male figure with a huge platform…gets all of the attention.”

While this might sound simply like sour grapes — and some of it likely is — the criticisms against Mr. Beast are much broader than many might suspect. For years, many have complained that Mr. Beast’s “philanthro-tainment’ strategy — combining philanthropy with online entertainment — is exploitative. 

For example, in February when Mr. Beast partnered with a non-profit organization to provide sight-restoring surgery — procedures Mr. Beast personally paid for — he was accused of “poverty porn.” 

“…it is all in the service of enriching himself,” one person tweeted.

“He cares about poor people and disabled people because they make him money,” another one said. 

“Doctors/nurses don’t exploit their patient’s dignity for profit.”

‘The Stranglehold of the Profit-Seekers’

The last word is key: profit

Profit has become a dirty word over the last century. Ayn Rand explored the growing distaste for profit at length in her classic work Atlas Shrugged, a dystopian novel that depicts a society in which the titans of industry who produce the goods and services of society are viewed with contempt by many — particularly moochers — for pursuing profit. 

James Taggart, a villain in the novel, talks of “breaking up the vicious tyranny of economic power” and setting “men free of the rule of the dollar.”

“We will liberate our culture from the stranglehold of the profit-seekers,” thunders Taggart.

Rand was conscious of the fact that our modern world was turning the idea of profits into a sin, even though economist Adam Smith long ago observed that self-interest is the source of economic prosperity in society. 

“It is not from the benevolence of the butcher, the brewer, or the baker, that we expect our dinner, but from their regard to their own interest,” Smith famously wrote in The Wealth of Nations

Smith understood that self-interest isn’t just healthy and rational; it’s the economic engine of society. In pursuit of his own desires, the butcher provides an essential service to others, just as the brewer and baker do.

Yet profit is anathema to many today, particularly those who’ve been inundated with social justice tropes at universities. The Marxist notion that profits are mere exploitation has been adopted by many, even by people who likely would never consider themselves Marxists. 

Like the failed businessman in Atlas Shrugged who defends himself by saying “I can proudly say that in all of my life I have never made a profit,” many young people now see profit as synonymous with exploitation. 

“Inspiring people to help others is great, but encouraging young [people] to exploit vulnerable communities for content which they can then profit off of enormously, is the issue,” tweeted the Washington Post’s grievance correspondent Taylor Lorenz.

In other words, the scorn heaped on Mr. Beast stems from the fact that he has accrued an estimated $500 million fortune while pulling off his remarkable humanitarian achievements. 

And it’s worth noting that the criticism he’s received is in notable contrast to the (initial) widespread praise of Sam Bankman-Fried, the FTX founder who built an empire singing a song of effective altruism and rejecting the importance of profits.

“It’s okay to do a deal that is moderately bad, in bailing out a place,” SBF said during a 2022 talk with Bloomberg

SBF let it be known he wasn’t very concerned about crass profits; he was far more focused on helping others. (A closer inspection of SBF’s private rhetoric and business shows he was far more concerned with making money for himself than he let on.)  

The difference is that Mr. Beast’s humanitarian efforts actually worked, whereas SBF’s “altruistic” efforts failed miserably (and he’s now facing more than 100 years in prison).

This is the real reason Mr. Beast is taking so much heat. He’s showing the power of voluntary action and the miraculous power of the profit motive. This isn’t just a stark contrast to SBF’s altruistic efforts, however. 

‘It’s Embarrassing’

One of the best quotes you’ll find on Mr. Beast’s humanitarian work in Africa comes from Kenyan journalist Ferdinand Omond.

“[I]t’s embarrassing that a YouTuber jetted into Kenya on a charity tour to perform tasks our taxes should have completed ages ago,” said Omond.

These words have to sting, in large part because they ring so true. 

Is this an embarrassment for the Kenyan government, which has long been plagued by inefficiency and corruption? Undoubtedly. But it’s also an embarrassment to every public intellectual who insists profits are evil and that government-led efforts are the solution to poverty, despite their dismal track record.

And it should be pointed out that the Kenyan government is not the only one that has proven utterly inept at fighting poverty. 

In 1964, President Lyndon B. Johnson famously declared “war” on poverty. Over the next five decades, the average wealth transfer, in real terms, to a low-income family increased from $3,070 per capita (1965) to $34,093 (2016). Economist Vance Gill last year estimated the federal government has spent a total of $25 trillion in its nearly 60-year War on Poverty.

What do we have to show for this fortune in federal spending? 

According to the United States Census, in 1966, the percentage of American families living in poverty was 12.4 percent. Today, according to new data from the US Census, the percentage of Americans living in poverty is … 12.4 percent.

That’s right. Since 1964, despite tens of trillions of dollars in spending at the federal level alone, the poverty rate in America has not budged; it has merely bobbed around the same level since the Beatles arrived in the British Invasion. 

Some could argue that poverty in America could be much worse if we hadn’t spent $25 trillion fighting it, but this ignores an inconvenient truth. In the two decades before the War on Poverty, poverty had fallen from 32.1 percent to 12.4 percent.

All of this helps explain why Mr. Beast is being attacked despite all the good work he is doing.

Milton Friedman famously said that one of the biggest mistakes humans make “is to judge policies and programs by their intentions rather than their results.”

The results of Mr. Beast’s philanthropy, which is all voluntary and profit-driven, surpass government-led efforts by miles. And that’s what his critics can’t handle. 

READ MORE 

Tags:  Leadership, International, Entrepreneurship, Art and Culture  


Jon Miltimore is the Managing Editor of FEE.org. His writing/reporting has been the subject of articles in TIME magazine, The Wall Street Journal, CNN, Forbes, Fox News, and the Star Tribune. Get notified of new articles from Jon Miltimore and AIER. SUBSCRIBE


Monday, September 25, 2023

Why Do The Poor Countries Always Stay So Poor?

September 22, 2023   @ Manhattan Contrarian 

It’s now more than sixty years since the independence movement in the late 1950s and early 1960s transformed nearly all of sub-Saharan Africa into independent countries. Hopes soared for a new era of progress and prosperity. But six plus decades on, with essentially no exceptions (maybe Botswana?), the 49 countries of sub-Saharan Africa are about as poor as ever.

The New York Times treats the subject in a big piece by Patricia Cohen a few days ago on September 18. Sorry if this is behind their paywall, but I subscribe to this stuff so that you don’t have to. In the treatment at the Times, this is just a case of the sad cruelty of nature, an extreme instance of “bad luck.” But we can learn a good deal about the true source of the bad luck by looking at clues that Ms. Cohen and the Times inadvertently drop in the course of their reporting, without even noticing that they are doing it.

The funny thing about the bad luck of sub-Saharan Africa is that it seems to afflict all 49 countries at the same time, even as elsewhere in the world at least a few countries (South Korea, Taiwan, Thailand) are able to find the magic recipe to rise out of poverty.

This week’s piece in the Times focuses particularly on the country of Ghana. The headline is “Crisis and Bailout: The Tortuous Cycle Stalking Nations in Debt.” The sub-headline is “The government of Ghana is essentially bankrupt, and has turned to the International Monetary Fund for its 17th financial rescue since 1957.” Seventeen financial bailouts in 66 years since 1957 would be more than one bailout every four years.

In Ms. Cohen’s reporting, the “tortuous cycle” of debt is just an inevitable fact of life for poor nations, one that somehow persists despite the best efforts of the very best and cleverest people. A few excerpts:

The government is essentially bankrupt. After defaulting on billions of dollars owed to foreign lenders in December, the administration of President Nana Akufo-Addo had no choice but to agree to a $3 billion loan from the lender of last resort, the International Monetary Fund. It was the 17th time Ghana has been compelled to turn to the fund since it gained independence in 1957. This latest crisis was partly prompted by the havoc of the coronavirus pandemic, Russia’s invasion of Ukraine, and higher food and fuel prices. But the tortuous cycle of crisis and bailout has plagued dozens of poor and middle-income countries throughout Africa, Latin America and Asia for decades.

The piece proceeds with heart-rending stories of Ghanaians seeing their lives up-ended as the currency collapses and the government defaults on its debts. For starters, here is the situation at a big construction project of an amusement park in the capital of Accra:

Emmanuel Cherry, the chief executive of an association of Ghanaian construction companies, sat in a cafe at the edge of Accra Children’s Park, near the derelict Ferris wheel and kiddie train, as he tallied up how much money government entities owe thousands of contractors. Before interest, he said, the back payments add up to 15 billion cedis, roughly $1.3 billion. “Most of the contractors are home,” Mr. Cherry said. Their workers have been laid off. Like many others in this West African country, the contractors have to wait in line for their money.

It’s a very sad story for the thousands of contractors who have done major work and are going unpaid. But wait a minute! The government is constructing an amusement park? And taking on upwards of a billion dollars of public debt to do it? Moreover, the full cost of the project must be well more than the $1.3 billion, since that is just the amount of unpaid bills currently outstanding. How could government financing of this project possibly make sense in an impoverished sub-Saharan country where the people lack for basic things like food, housing and electricity?

I would say it is completely obvious that no government should be in the business of financing and building amusement parks. Here in the U.S., I’m sure that a Disney or a Universal can hit up Florida or California for some tax breaks or other baksheesh from time to time for their big parks. But financing the whole thing with central government bonds? That’s ridiculous. And yet somehow Ms. Cohen and the Times don’t notice anything out of line.

Read a good deal farther into the article, and you come to this:

As Ghana’s foreign reserves skidded toward zero, the government began paying for refined oil imports directly with gold bought by the central bank.

OK, why is the government paying for refined oil imports? Does the U.S. government pay for the imports of oil products into the U.S.? Maybe yes for a tiny percentage, perhaps for an overseas military base; but almost entirely, oil imports into (or exports out of) the U.S. are done by private parties. Again, Ms. Cohen and the Times don’t evidence any awareness that government pre-emption of such an economic sector can come to no good.

Obviously the government is way too involved in what should be private sector businesses, running up debts for uneconomic endeavors and then inevitably defaulting when the government lacks the ability (as all governments do) to run the businesses profitably.

So Ghana is falling back into the suffocating embrace of the IMF for the 17th time since independence. After all, as the Times says, they have “no choice.” And we all know what is the universal prescription of the IMF for impoverished countries: more government spending and higher taxes.

How could that possibly make sense? If you don’t immediately grasp the logic, you need an education in IMF-speak. I had a post back on June 19, 2017 covering this subject. The title was “The Important Work Of International Agencies: Keeping The Poor Poor.” That post highlighted a quote from then IMF head Christine Lagarde as to how higher taxes and higher government spending are the magic elixir for alleviating poverty. Note Ms. Lagarde’s weird bureaucratic terminology:

[W]e are here to discuss an equally powerful tool for global growth — domestic resource mobilization. . . .  [T]axes, and the improvement of tax systems, can boost development in incredible ways. . . .  So today, allow me first to explain the IMF’s commitment to capacity development and second, to outline strategies governments can use to generate stable sources of revenue…

“Domestic resource mobilization” — that’s IMF babble for higher taxes and higher government spending. After all, you need to get the resources out of the hands of the layabout private citizens and into the hands of the brilliant government bureaucrats to make sure that they are “mobilized” appropriately. Multiple decades of this, and every one of the 49 sub-Saharan countries remains poor.

Meanwhile, Ms. Lagarde has failed upward to become the head of the European Central Bank. Her replacement at the IMF, Kristalina Georgieva, has not changed anything as far as I can discern. After all, if poor countries did not default regularly, and need bailouts, what would the functionaries at the IMF do?

I would not expect the “tortuous cycle” of debt and poverty for Ghana, or for other poor countries, to change any time soon. Too many well-paid people at international bureaucracies have a vested interest in keeping the game going just as it is.


Monday, September 18, 2023

Continuing Manipulation Of Poverty Statistics

September 16, 2023 @ Manhattan Contrarian 

As I have written many times, I don’t think that the federal measure of “poverty” in the United States was originally created with fraudulent intent to deceive the voters. However, as the measure of poverty has evolved over the years, the thing deemed “poverty” by the statistics no longer bears any meaningful resemblance to what normal people think of as poverty. Rather than measuring anything that might resemble actual physical deprivation, the statistics have evolved into an artifact to manipulate the voters. In a post about a year ago I described what I call the “poverty scam” as follows:

[T]he government cynically manipulates the poverty statistics so that the official measured rate of poverty never goes meaningfully down, no matter how much taxpayer money is spent, thus manufacturing a fake basis to hit up the people for ever increasing funding at regular intervals.

Over the past week or so we have just been treated to the umpteenth iteration of this poverty scam.

On September 12 the Census Bureau put out a press release announcing its latest income and poverty data, covering the year 2022. The New York Times covered the release with a big piece the same day: “Poverty Rate Soared in 2022 as Aid Ended and Prices Rose.” From the Times:

The poverty rate rose to 12.4 percent in 2022 from 7.8 percent in 2021, the largest one-year jump on record, the Census Bureau said Tuesday. Poverty among children more than doubled, to 12.4 percent, from a record low of 5.2 percent the year before. Those figures are according to the Supplemental Poverty Measure. . . .

Now, an increase in the poverty rate from 7.8% to 12.4% in one year sounds like a huge jump — more than 50% in terms of the number of people deemed to be living “in poverty.” How could that have happened in a year which had seemed to be a year of recovery from the pandemic, and with an apparently tight labor market? According to the Times, the key factor was the ending of government aid programs, specifically those related to the Covid pandemic:

[S]afety net programs that were created or expanded during the pandemic. . . included a series of direct payments to households in 2020 and 2021, enhanced unemployment and nutrition benefits, increased rental assistance and an expanded child tax credit, which briefly provided a guaranteed income to families with children. Nearly all of those programs had expired by last year, however. . . .

But the expenditures the Times lists were never intended as anti-poverty measures. What happened to actual anti-poverty spending between 2021 and 2022? As far as I can determine, it did not go down, but rather went up, and not by a little. According to a Cato Institute study here, federal anti-poverty spending in 2021 was approximately $1.1 trillion; and according to a House Budget Committee release here from March 15, 2023, federal spending on its welfare and anti-poverty programs for fiscal 2022 (ending on September 30, 2022) was approximately $1.19 trillion. In other words, there was an increase of close to $100 billion, or over 8%.

So can we get to the bottom of what is going on here? Note that in the Times article they specifically state that the increase in the poverty rate is as measured by something called the “Supplemental Poverty Rate.” That’s the New Coke poverty rate created during the Obama administration to introduce a definition of “poverty” as something no longer absolute, but rather relative to median income, and that therefore would be resistant to ever decreasing no matter how much the incomes of low income people might rise. So what happened in the same year to poverty as measured by the so-called “official” poverty rate (based, supposedly, on an absolute measure of poverty)? Read deeper into the Times piece — like, fifteen paragraphs deeper — and you get this:

The “official” poverty rate — an older measure that is widely considered outdated because it excludes many of the government’s most important anti-poverty programs, among other shortcomings — was nearly flat last year, at 11.5 percent, . . . By that measure, the poverty rate for Black Americans was 17.1 percent, the lowest rate on record.

In other words, this Official Poverty Rate isn’t useful for our purposes in this round, so we will emphasize the other one. A chart accompanying the article shows that the measure of the “official” poverty rate did not budge between 2021 and 2022, despite the large changes in funding including expiration of Covid-related programs and increases in anti-poverty programs:

Now that the Supplemental Poverty Rate has bounced back to be slightly above the Official Poverty Rate, it looks like the natural order of the government poverty statistics has been restored. $1.2 trillion or more of federal anti-poverty spending every year, and the poverty rate, by either measure, just stays right around the same 12% or so. And so the stage is set for the next round of advocacy for increased spending to alleviate poverty, none of which will ever bring the measured rate down meaningfully for any period of time.

Thursday, January 12, 2023

You Must Assume That All Information Put Out By Our Government Is Corrupt

December 21, 2022 @ Manhattan Contrarian

Throughout the agencies of our federal government, an important function is to issue data and information about the state of the country. These data cover a vast array of topics such as population, demographics, income and poverty, the state of the economy, the GDP, employment and unemployment, activities of foreign adversaries, weather and climate, energy production and use, and much, much more. The Congress and states use this information in making important public policy decisions, and the people use it to make decisions for their everyday lives. Not the least of those decisions is how to vote.

So is the information issued by the government basically honest and reliable for important decisions? Or, instead, is the output of official information cynically manipulated and corrupted by a government interested mainly in perpetuating and increasing its own power? And given that the federal bureaucracy is 90+% Democrat in political orientation, to what extent does that bureaucracy manipulate the information it issues to further the election of Democrats?

The evidence of data manipulation in favor of Democrats is so pervasive that we have to assume that essentially all information put out by the government is corrupt.

The instances of blatant manipulation of information by government personnel are way too clear and way too widespread to be ignored. What is now being called the “Twitter files” — shocking evidence of the FBI working with a big tech company to limit the circulation of information about corruption by one of the presidential candidates in the run-up to the 2020 election — is just one of the latest examples. Let’s have a review of some others:

Manipulation of temperature data to support the narrative of human-caused climate change.

Long-time readers here are undoubtedly familiar with my series, now of some 30 parts, on what I call the Greatest Scientific Fraud Of All Time. The headline refers to the alteration by U.S. bureaucrats of historical climate records to make it appear that temperatures have closely tracked the ongoing increase in CO2 in the atmosphere, when in fact the actual temperature readings show the opposite. The U.S. climate bureaucracies NASA and NOAA regularly put out excited press releases about the most recent month or year being the “hottest on record,” or something like that. But anybody can go to past information releases to find that those statements only hold if one accepts alteration of prior information to support the narrative.

My October 20, 2020 post contained the ultimate smoking gun: two NASA charts of U.S. temperatures, one from 1999 and the other from 2019, clearly showing the alteration of early-year temperatures to support the claim that the most recent years are the warmest. Here are those two charts:

In NASA’s data in 1999, 1934 was the warmest year in the U.S. temperature record, about 0.6 deg C (1 deg F) warmer than 1998; 1921, 1931 and 1953 were also warmer than 1998. By 2019, 1998 had somehow become the warmest year, through the magical cooling of the earlier years. And thus do we get a claim that there is some kind of dangerous warming going on that requires a full transformation of the U.S. and world energy system, all under the direction of the all-knowing bureaucrats.

Manipulation of poverty data to support demands for ever-increasing amounts of anti-poverty programs and funding

Look under my tag for Poverty, and you will find one post after another detailing how government poverty statistics showing high rates of poverty in the U.S. are used to support advocacy for increasing programs and funding supposedly to reduce the poverty; and then after the programs and funding are increased the measured poverty never goes down. We’re now up to well over $1 trillion per year in anti-poverty funding in the U.S. (all levels of government), and the official “poverty rate” as measured is right around the same place it was when the War on Poverty started back in the 1960s.

How is this possible? The very simple trick is that the government “anti-poverty” funding never gets counted when official poverty is measured The statistics are very intentionally and cynically manipulated to be misused to advocate for growing government programs and dependency.

The latest iteration of this scam has been going on for the last several months, and continues in the so-called Omnibus bill even now making its way through Congress, in the form of a vastly expanded child tax credit. Claims are everywhere, including from President Biden personally, that the expanded child tax credit has or will cut child poverty in the U.S. “in half,” or something in that range. A release from the Census Bureau itself on September 13 bragged that the expanded child tax credit had “contributed to a 46% decline in child poverty since 2020,” to a rate of only 5.2%.

But by October 4 the Census Bureau was back to its old tricks:

The child poverty rate (for people under age 18) was 16.9% in 2021, 4.2 percentage points higher than the national rate. . . .

Wait a minute — what happened? Easy — they keep two sets of books on the “poverty” rate, the better to manipulate the gullible and under-informed public. Here they just reverted to the other measure of “poverty” where tax credits don’t count when they want to run up big “poverty” figures to support advocacy for yet more government spending and programs.

Try looking through that October 4 release to see if you can find any mention that they were bragging just a few weeks previously about the clild poverty rate having been reduced to 5.2%. It’s not there.

Manipulation of employment figures in the run-up to the 2022 mid-term election

John Hinderaker at PowerLine yesterday has yet another instance of blatant government manipulation of official statistics to support election of Democrats, this one coming out of the Bureau of Labor Statistics. In early July 2022 the BLS reported a big number for job growth in the second quarter (April to June) of over 1 million jobs. That supposed job growth became the centerpiece of President Biden’s economic message for the midterms. The Hill quoted Biden on July 28 as follows:

Our job market remains historically strong, with . . . more than 1 million jobs created in the second quarter alone.

On December 13 the Research Department of the Philadelphia Federal Reserve Bank came out with revised figures for second quarter job growth:

In the aggregate, 10,500 net new jobs were added during the [March to June] period rather than the 1,121,500 jobs estimated by the sum of the states; the U.S. CES [Current Employment Statistics, put out by BLS] estimated net growth of 1,047,000 jobs for the period.

Off by a factor of about 100. Oh well, it’s now December, and we’re well past the election.

Does any agency in the U.S. government put out honest information today? Maybe, but how would you ever know? At this point you must assume that that absolutely everything is corrupted, in the particular direction of supporting election of Democrats and further growth of the government.


Tuesday, January 10, 2023

Chicago’s Downward Spiral

January 10, 2023 by Dan Mitchell @ International Liberty

It’s not easy to identify America’s worst-governed city. You can make a case for jurisdictions such as San FranciscoDetroitNew York City, Minneapolis, or Seattle.


For what it’s worth, there is statistical research from last decade showing places like New York and Los Angeles are among the worst of the worst, but I wonder if Chicago actually deserves top billing

There are many reasons to criticize the Windy City. Crime is rampant, taxes are excessive, and schools are terrible.

And, to make matters worse, Chicago is in America’s worst-governed state (at least based on my poll, which is not scientific but is probably accurate).

I already wrote once about bad public policy in Chicago. Today’s column is going to show that things are getting even worse.

I’ve written about how taxpayers are fleeing poorly governed states. Well, they’re also fleeing poorly governed cities. And the AP reports that Chicago is a popular place for companies…to leave.


The Chicago area saw an exodus of corporate headquarters in 2022, including investment firm Citadel, which moved to Miami along with its billionaire founder, Ken Griffin; Caterpillar, which relocated from north suburban Deerfield to Irving, Texas; and aerospace giant Boeing, which moved to Arlington, Virginia, after more than 20 years in the West Loop. The most recent high-profile departure was announced in November, when Lake Forest-based auto parts manufacturer Tenneco said it was shifting its headquarters to Michigan. …vacancy rates in the central business district rose to 19.6%, while the Chicago metro ticked up to 21.8%… Meanwhile, Citadel principals and employees generated billions of dollars in tax revenue for the city and state over the past decade, according to the firm, money that has also headed south.

And why are businesses escaping?

As Adam Schuster explained last October in National Review, the city’s economic management is getting worse.


Can anything be done to save the financial future of one of America’s largest and best cities? …Let’s go through the numbers. The business community is right that a property-tax increase is unnecessary considering the $3.5 billion in pandemic-related federal aid. ..The property-tax hike could be prevented by using just 2.5 percent of Chicago’s $1.9 billion in American Rescue Plan funding. But instead of using the aid to prevent tax hikes that would impede Chicago’s economic recovery, the city has proposed to use those billions to create new programs. The mayor’s proposed budget increases spending by roughly $1.2 billion… Unfortunately, that spending is propped up by one-time federal aid that expires by 2024 — meaning many programs will have to be…financed with significant tax hikes within just two years. And about those pensions: Pension costs will consume more than $2.3 billion of the city’s budget, or 21.4 percent of its own source revenue, excluding state and federal grants. That’s more than a $967 million increase in pension spending since Lightfoot became mayor and $461 million more than last year alone.

In other words, the city is trying to raise taxes today while also making decisions (especially regarding unfunded pensions) that will almost surely mean additional tax increases in the future.

No wonder people and business are fleeing the state and the city.

P.S. To make matters worse, Chicago still has major problems with corruption.

P.P.S. My long-run fear is that politicians in DC will provide bailouts for profligate cities and states.

Should Government Anti-Poverty Programs Promote Independence or Dependence?

January 05, 2023 @ Manhattan Contrarian

Here’s a question where I’ll bet you think the answer ought to be completely obvious: Should the purpose of government “anti-poverty” programs be to help the beneficiaries rise from poverty and become successful and independent, or alternatively should the purpose of such programs be to entice the recipients of aid into a life of permanent dependency upon government handouts? From the earliest days of the anti-poverty programs back in the 1960s, the programs were sold to the public as being a temporary boost by which the poor could be helped to escape from poverty and achieve self-sufficiency. And yet, about six decades in, the rate of poverty never seems to go down, and the number of program beneficiaries grows inexorably. Did something change along the way?

The answer is yes. A new book I’ve just read documents a 180 degree reversal of our government’s policy on the purpose of the anti-poverty programs since the time they began. The book is “The Myth of American Inequality,” by authors Phil Gramm, Robert Ekelund and John Early, published in September 2022. You may recognize Gramm as having been a three-term Senator from Texas (1985-2002). Ekelund is an academic economist, currently at Auburn University, and Early has had a career largely in government statistical offices including the Bureau of Labor Statistics.

Not to overly flatter myself, but this book mostly covers subjects that I have been harping on for a decade or so, accumulated under my tags for Poverty and Income Inequality. However, these guys are much more knowledgeable than I am about the nitty-gritty of how the government statistics on poverty and income inequality are compiled, and I highly recommend their rendition if you want to really understand many of the machinations of our bureaucracy in producing statistics designed to gain support for further growth of the government.

The title of the book — “The Myth of American Inequality” — refers to the statistical legerdemain by which the government statistical bureaucrats (mainly in the Census Bureau and Bureau of Labor Statistics) are able to make poverty and “income inequality” in the U.S. appear far, far greater than they are in reality. From a summary statement in the first chapter, page 4:

The official measure of the poverty rate which uses the Census Bureau definition of income, does not count two-thirds of all transfer payments as income to the recipients. As a result, for more than fifty years, the measured income of low-income Americans has been substantially understated. As we will show, when you count all transfer payments as income to the households that receive the payments, the number of Americans living in poverty in 2017 plummets from 12.3 percent, the official Census number, to only 2.5 percent.

If I have one main criticism of the book, it is that the authors do not forcefully state that the statistics on poverty and income inequality as presented today are fundamentally fraudulent and deceptive, nor do the authors put any blame on anyone for allowing these statistics to become so distorted and misleading over time. It’s like it was just some naturally-occurring process, and things just turned out this way. My own many posts on these subjects do not give that kind of the benefit of the doubt to our self-serving bureaucrats.

The book comes closer to asserting intentional government wrongdoing in describing the inversion of the purpose of the anti-poverty programs from promoting independence to promoting dependence on government. At page 67, the authors quote from President Johnson in his March 16, 1964 address to Congress proposing the War on Poverty:

Johnson’s stated policy objective [was] “to allow them to develop and use their own capacities.”

But then, according to the authors, something big changed, around a time they identify as “the turn of the twenty-first century”:

It appears that both the objective and the method of outreach started to change around the turn of the twenty-first century. Government has not only raised benefits and lowered the eligibility standards, but also started actively to urge people to become more dependent on government. From 2000 through 2016, the US Department of Agriculture (USDA) conducted aggressive recruitment efforts that it claimed boosted food stamp enrollment by 157 percent. USDA spent $40 million annually on advertising to recruit beneficiaries, above and beyond the usual public service announcements concerning the availability of benefits. Seniors and Hispanics were targeted with the dramatized message that they were entitled to the benefits, had paid taxes for them, and should feel guilty because, by refusing to apply for them, they were hurting their families.

And it goes on and on from there. Examples:

  • “USDA . . . trained state and local social service agencies to encourage their public assistance clients to enroll in food stamps.”

  • “One [USDA] training module was titled ‘Overcome the Word “No,”’ which taught techniques for changing the attitudes and values of people preferring not to enroll in food stamps.”

  • “USDA rewarded and publicized state social service agencies for their success in overcoming the ‘mountain pride’ of potential beneficiaries ‘who wished not to rely on others.’”

The authors assert that these kinds of efforts to recruit people into dependency are largely to blame for the substantial disappearance over the last several decades of earned income among people in the bottom quintile of the income distribution, with the former earned income of people in this quintile now replaced with government transfers of various sorts. From pages 67-68:

In the fifty years after the funding for the War on Poverty ramped up in 1967, the bottom quintile’s share of the nation’s earned income fell by more than half. . . . Nevertheless, the standard of living among lower-income households improved substantially from massive government subsidies.

In placing the sea change in the purpose of the anti-poverty programs “after the turn of the twenty-first century,” the authors never attempt to put accountability on any particular administration, or on the bureaucracy or any particular part of it. Was this change brought about by George W. Bush? Or was Obama more responsible? Or was this the bureaucracy following its own internal imperatives with little or no direction or control from the elected leaders? These authors aren’t going to tell us.

My own take is that where we are now is the position that the bureaucratic imperative of growing staff and budget was always heading toward. It would take constant focus and pushback from the elected President and his administration to keep the programs from getting perverted into vehicles for permanent dependency. Obama certainly offered no such pushback, but rather overt encouragement. G.W. Bush may not have given full encouragement, but also never pushed back to the extent he should have.

Anyway, if you buy and read this book, as well as my 100 or so prior posts on these subjects, you will then be among the several dozen people in the country who are on to the statistical scams by which the bureaucracy manipulates the voters into supporting more and more government spending, none of which ever can or will reduce “poverty” or “income inequality” as the government measures them. These few dozen of us will then only need to bring around the tens of millions who have fallen for the scams in order to get some reforms going. Let’s get to it!

Monday, November 28, 2022

COP-27: A Window Into How The UN Keeps The Poor Poor

November 24, 2022 @ Manhattan Contrarian

Even as we give thanks today for the wonderful benefits of a freedom-based political and economic system, the UN’s big annual “climate” conference, this year going by the moniker COP-27, has only recently wound up. As with most everything the UN does, there was nothing in this conference for anyone to be thankful for.

This year, with the activists’ beloved wind and solar energy sources manifestly failing to solve Europe’s energy crisis, there was little prospect for any major new agreements to limit CO2 emissions. And thus there was far less media coverage than of past such conferences.

But we should not let the event pass without noting the extent to which this conference, like most of what the UN does, evidences the alliance between elite rich-country activists and corrupt developing-country interests, all to keep the poor poor.

Now, you might ask, why would anyone want to keep the poor poor? The world continues to have at least a billion or more people who live in grinding poverty, without basic things like safe water, sanitation, home heat, or electricity. A plurality of those people live on the continent of Africa, with a population of about 1.4 billion, some 500 million of whom live in “extreme poverty” according to the definition and data of the UN itself. Surely, every moral person would want to find a way for those poor people to exit poverty and move up to at least what we consider a middle class lifestyle.

But of course, that is not the case. In the wealthy countries, the elites find themselves hypnotized by the pagan climate cult, with the fundamental belief that use of hydrocarbon fuels is the ultimate mortal sin. These people might mouth platitudes about wanting to help the poor to exit poverty, but at the same time they have no practical idea where their own prosperity comes from, or that it completely depends on abundant energy from fossil fuels. Meanwhile, they are only too willing to use their influence to prevent the poor from using fossil fuels, in the absence of any functional alternative, thus leaving the poor to languish in poverty.

And how about the people that govern the developing countries? You might think that they would badly want to help their people to exit from poverty, but most often that is not in fact the case. Consider developing countries’ policies as to the use of fossil fuels. Their posture on the issue is not completely uniform, and some countries that have abundant fossil fuel reserves, particularly if controlled by the government, are ready to push to develop those resources. However, many other countries go willingly along with the Western pressure for no development of fossil fuels. It’s simple. If you allow exploration and development of these resources, you risk the rise of wealthy local rivals for your power. Much better to accept handouts from the rich countries, which you can package as “climate reparations,” and then use for palace guards and secret police to cement yourself in power. Or maybe just put the money straight into your Swiss bank account. Meanwhile, you can mouth some empty words about “saving the planet,” and probably get yourself fawning attention from the liberal Western press, if not a Nobel Peace Prize.

And the UN? Its institutional interest is to be the intermediary in the massive wealth transfer from the rich to poor countries. The more wealth is transferred, the more need for UN staff and bureaucracy to administer the process. And God forbid that the poor countries should get rich and not need the wealth transfers any more. What then would be left for the UN to do?

Once you understand these perspectives, the proceedings at COP-27 and the events leading up to it all come to make sense.

Paul Driessen of CFACT, writing at Shale Directories on November 22, rightly calls COP-27 the “Anti-African” conference:

[T]he greatest hypocrisy of all was on full-throated display at the COP-27 climate circus in Egypt November 6-18 – where attendees kept asking whether Africa should be allowed to exploit its oil, natural gas and coal reserves to improve living standards, feed families and save lives! . . . Even worse, it’s not just energy these arrogant eco-totalitarians want to obstruct in Africa and other developing regions. It’s also modern fertilizers — indeed, all aspects of modern agriculture – everything that can actually help farmers feed hungry people and make enough money to build a home or barn, send their children to school, and buy tractors and other equipment.

In a piece on November 7 — as COP-27 was getting under way — Reuters summarized the position of Western environmentalists toward the idea of Africa developing its fossil fuel resources:

Climate campaigners have pitched themselves against African governments that believe they should be allowed to use gas - which emits less climate-heating carbon dioxide than coal and oil when burned - to develop their economies and provide power to 600 million Africans who still lack access to electricity. Activists raised the alarm last month when Tarek El Molla, Egypt's minister of petroleum and mineral resources, told a ministerial meeting of the Gas Exporting Countries Forum (GECF) that fossil gas is "the perfect solution" to "achieving the energy trilemma for security, sustainability and affordability". . . . But advocates for renewables are calling for no more investment in gas. . . .

Al Gore of course weighed in with a call for the entire world to “turn away” fossil fuels. And in the run-up to the conference in September, U.S. “climate envoy” John Kerry “warn[ed] Africa not to rely on natural gas to bring power to millions.”

Also in the run-up to the conference, the UN Environmental Program (UNEP) put out a big Report titled Emissions Gap Report 2022, calling on all countries, even the poorest, to eliminate use of fossil fuels. Over at DW on October 27, they quote John Christensen of Danish think tank Concito on the UN’s findings:

[T]he UNEP report authors explored deeper solutions via . . . "system-wide transformation." This includes the decarbonization of the electricity supply, industry, transport, buildings and food systems. . . . "It's about all countries in all sectors, but needs to reflect national contributions and circumstances," said Christensen.

Meanwhile, Gore and Kerry have each jetted back to one of their many mansions.


Thursday, September 15, 2022

The Latest Pre-Election Bait And Switch On Poverty Statistics

September 13, 2022 @ Manhattan Contrarian 

 It’s September, in an even year. Labor Day has passed. The big mid-terms are less than two months away. It’s time for a pre-election bait and switch on poverty statistics to deceive any low information voters who aren’t paying attention to how the poverty scam works.

The poverty scam has been a big topic over the years at this blog, although perhaps less so in the most recent couple of years. This link will take you to all my prior posts on Poverty, some 129 in total. The most important recurring theme has been that the government cynically manipulates the poverty statistics so that the official measured rate of poverty never goes meaningfully down, no matter how much taxpayer money is spent, thus manufacturing a fake basis to hit up the people for ever increasing funding at regular intervals.

But there is an exception. When a big election is coming up and the Democrats are in power, suddenly alternative statistics magically emerge showing that poverty has dropped dramatically, all of course due to compassionate programs put in place by the Democrats. And thus we have two pieces from the front page of the New York Times in the past two days. From yesterday, it’s “A Quiet, Dramatic Blow to Childhood Poverty” (different headline in online version); and today it’s “Families Lifted By Safety Net Tell Their Stories” (again, different headline online). Both have the by-line of long-time Times “poverty” reporter Jason DeParle.

Before getting to a detailed consideration of the two latest pieces from the Times, let’s have a review of some history. My first post on what I called the “poverty scam” goes all the way back to the very beginning of this blog in November 2012. That linked post pointed out that almost all government “anti-poverty” spending was in-kind, rather than in cash, and that the Census Bureau systematically and cynically excluded all in-kind spending and tax credits when calculating its official measure of poverty. Thus, no matter how much money was spent via these programs, the poverty rate would never go down, and the seemingly high poverty rate could regularly be used as a basis to advocate for yet more anti-poverty spending. From the November 2021 post:

There is nothing honest about the exclusion of in-kind benefits from the definition of poverty. The main results of the exclusion are (1) the public thinks that the "poverty" rate is measuring something about material deprivation, but it is not, and (2) additional spending, even hundreds of billions of dollars of it, cannot ever make any dent in the poverty rate, even as the government spends more per family in poverty than the median income of a family of four in the entire country.

And that was indeed the usual order of things year after year. But then we came up on the 2016 election. Barack Obama was President, the Democrats ran the government, and Hillary Clinton was running for President against Donald Trump. Suddenly things changed. In September 2016 the Census Bureau came out with a suspiciously-timed big Report showing large gains in median household income, and a big drop in the poverty rate, from 2014 to 2015. On September 25, 2016 — the day of the first presidential debate — the New York Times weighed in with a big article headlined “With Pay Rising, Millions Climb Out of Poverty”:

3.5 million Americans . . . were able to raise their chins above the poverty line last year, according to census data released this month.

I responded with a post on September 27 titled “Fraudulent Advocacy For Government Growth.” That post noted that the supposed sudden drop in poverty actually resulted from changes in methodology by which Census compiled the statistics — particularly some conveniently-timed additional efforts to track un- and under-reported income. Whatever.

As soon as the election was over, and Trump installed in office, the Census Bureau and the usual advocacy groups resumed the use of the standard inflated poverty statistics, now mostly in the effort to bash the hated President Trump. Consider a few headlines covering 2017-2020, the years of the Trump presidency:

  • From the New York Times, September 13, 2018, author Glenn Thrush, “U.S. Recovery Eludes Many Living Below Poverty Level, Census Suggests”: “On Wednesday, the Census Bureau released its 2017 annual report on the poor that offered a stark counterpoint, suggesting that the national recovery has bypassed many of the 40 million to 45 million Americans estimated to be living below the federal poverty level.” It’s fascinating how, exactly the same amount of time before a mid-term election as today, the narrative was 180 degrees the opposite with Trump in office instead of Biden.

  • From the American Academy of Pediatrics, September 14, 2021: ”About . . .16.1% of children lived in poverty in 2020, according to new reports from the U.S. Census Bureau. The 2020 child poverty rate marks an increase from 14.4% in 2019. About 11.6 million children and adolescents under age 18 lived in poverty in 2020, an increase of 1.1 million from 2019.

  • From the Children’s Defense Fund, May 3, 2021, “The State of America’s Children 2020”: “Children remain the poorest age group in America. Nearly 1 in 6 lived in poverty in 2018—nearly 11.9 million children (see Table 2). The child poverty rate (16 percent) is nearly one-and-a-half times higher than that for adults.”

  • From the New York Times, May 7, 2022, by-line Bruce Covert: “We Pay to Keep the Old Out of Poverty. Why Won’t We Do the Same for the Young?”

    “The United States has an incredibly high child poverty rate. Nearly one in seven children lives in a poor family. By comparison, fewer than 10 percent of adults are poor, and under 9 percent of those age 65 and over are. Child poverty also doesn’t fall evenly across demographics: 71 percent of poor children are Black, Hispanic or Native American. . . . There’s a very simple reason for this: We don’t give parents enough money to raise their children.”

Well, welcome to September 2022. With less than two months remaining to the election, it’s time for a temporary 180 degree narrative change to prove that all the spending programs are actually working. From DeParle’s piece yesterday:

For a generation or more, America’s high levels of child poverty set it apart from other rich nations, leaving millions of young people lacking support as basic as food and shelter amid mounting evidence that early hardship leaves children poorer, sicker and less educated as adults. But with little public notice and accelerating speed, America’s children have become much less poor. A comprehensive new analysis shows that child poverty has fallen 59 percent since 1993, with need receding on nearly every front.

Since 1993? In other words, this Times piece completely contradicts the official left-wing narrative covering the Trump years, including the pieces linked above from the AAP, CDF, and even in the Times itself. Here is the Times’s chart of the decline in child poverty since 1993:

Note that the chart goes only to 2019, and reflects a dramatic decline in child poverty on Trump’s watch, and nothing about the Biden time period — although you won’t find any mention of that in the text of the article.

So how could the likes of the AAP, the CDF, and the Times’s own Messrs. Thrush and Covert have missed this? The answer is that there is nothing real here, and it’s only the usual statistical legerdemain to support the narrative needed for this particular moment. The labels in the chart give away the game. For the current purpose, we are now counting in-kind benefits and tax credits, notably the earned-income tax credit and the child tax credit (as well as food stamps, as the text of the article makes clear). In other words, this is the so-called “Supplemental Poverty Measure,” rather than the usual “Official Poverty Measure,” in which these handouts would have been arbitrarily excluded. When AAP, CDF and the Times wanted to bash Trump, they used the Official Poverty Measure, which contained more useful figures for that purpose.

Note that I’m not by any means saying that the Supplemental Poverty Measure is any more honest than the Official Poverty Measure. The SPM has its own major problems, some of which I have previously covered, for example here. It’s just that the Times, and its compatriots in left-wing advocacy, cherry-pick whatever statistics they need to support the official narrative of the moment. Once the election is over, the business about the child poverty rate going down is highly likely to disappear as we go back to the usual line about extraordinarily high child poverty in the United States. Statistics from the Official Poverty Measure will be used to support that narrative. How many people will be able to figure out that they are being played?