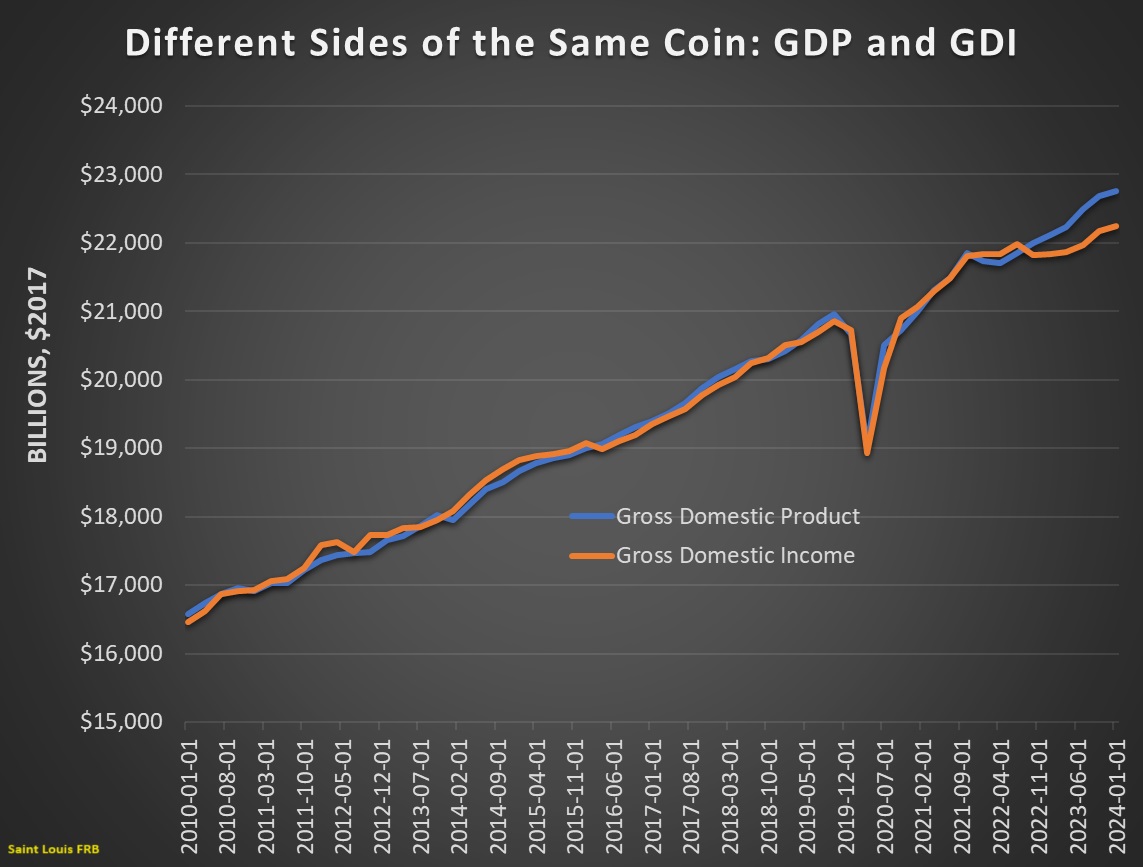
I periodically write wonky columns explaining that gross domestic income (GDI) is a better measure than gross domestic product (GDP) because it is more useful to focus on how income is earned rather than how it is allocated.
There’s not a meaningful difference between GDP numbers and GDI numbers, as illustrated by the chart. But that’s hardly a surprise because they are basically different ways of measuring the same thing.
That being said, understanding the distinction between GDI and GDP is especially useful when debunking Keynesian economics (Keynesians think increasing government spending boosts national income, which is just as illogical as thinking that spending more at the local bar increases household income).
While GDI is better than GDP for those who want to understand the shortcomings of Keynesianism, it is not a perfect measure.
The salaries and benefits of government bureaucrats are part of the equation, for instance, even though such expenditures probably detract from national prosperity.
So I was very interested to see some new research, authored by Professors Vincent Geloso and Chandler Reilly, that looks at economic history using an improved measure of economic output. Here is their explanation of the methodology.
Traditionally, GDP and GNP calculations assume that market prices accurately reflect the value of all goods and services produced. However, this assumption fails when it comes to government services. Government goods and services are rarely directly priced in markets. Instead, their value is often estimated as the sum of spending on public sector salaries and government purchases of goods and services (e.g., computers, furniture, public office workers, etc.). This method is problematic because a hypothetical government worker hired to “do nothing” ends up being considered as producing “something”. …we revised national accounts for the United States from 1790 to today by correcting price indexes in war and removing military outlays. The goal was to arrive at a truer measure of living standards.
And here are some of their results.
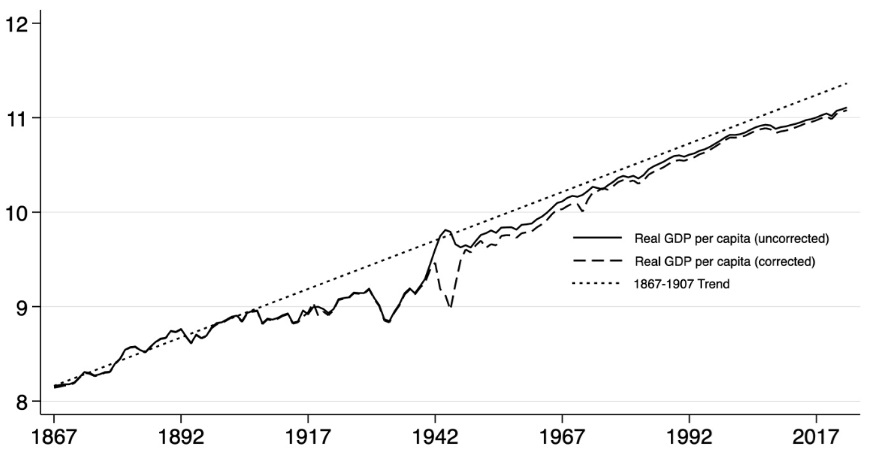
Our corrections suggest that the period from 1867 to 1907, the U.S. economy experienced incredibly fast growth, with per capita income rising by an average of 2.1% to 2.5% annually… for the period from 1907 to 1948, our adjustments indicate that the economy experienced repeated severe contractions.
For example, uncorrected statistics suggest that living standards increased massively during World War I and World War II. Our revisions, however, suggest they fell moderately during World War I and significantly during World War II. …lthough the economy did begin to enjoy fast growth rates after 1947—comparable to the pre-1907 period—it did not return to the previous trend “path.” …The permanent setbacks during the interceding four decades led to a long-term reduction in living standards, relative to what would have been achieved had the pre-1907 growth path continued.
This finding suggests that the period from 1907 to 1947, which encompasses the Progressive and New Deal era, represents a “great deviation” from America’s economic potential. …The Progressive and New Deal eras, with their emphasis on government intervention and regulation, set the stage for this permanent deviation.
The authors include this chart, which shows that growth suffered beginning with the so-called Progressive Era.
Sub-par economic performance also characterized the Great Depression and World War II, with the economy finally getting back to normal growth afterwards (but never returning to the long-run trend).
Give the bad policies of the Progressive Era (including income tax, central bank, antitrust) and Woodrow Wilson, I’m not surprised that growth slowed down, especially when you add the resource misallocation of World War I.
And Hoover and Roosevelt were very bad as well, so their policies also hurt the economy, as did the resource misallocation associated with World War II.
I’ll close by noting that growth sort of returned to normal after World War II because bad policies in some areas were offset (and perhaps then some) by good policies in other areas.
P.S. Looking at the chart, it is worrisome that economic performance has tailed off in recent years. I hope that is just a statistical blip, but I worry that all the bad policies this century (Bush, Obama, Trump, and Biden) are having a cumulatively bad effect.


No comments:
Post a Comment