March 7, 2022 by Dan Mitchell @ International Liberty
As part of my ongoing efforts to show that free enterprise produces better results than statism, I often use data on per-capita economic output – especially when comparing nations over long periods of time.
And I’ll sometimes build upon those numbers by comparing consumption levels in different nations.
But what if we’re looking at one country rather than several nations?

In the case of the United States, it is useful to peruse data on GDP and consumption, but I’m also a big fan of using the Census Bureau’s data on inflation-adjusted median household income (though even this data isn’t perfect because household sizes are declining over time).
These numbers allow us to gauge, over multi-year periods, whether government policies are making life better for average families. Or whether they are producing stagnation.
But what if we don’t have several years of data?
That’s a very relevant question since we’re in the midst of my series on Bidenomics.
The president has only been in office for a little over one year, so we don’t even have medium-run data, much less long-run data. Moreover, I’m always cautious about using data for just one month, one quarter, or one year. After all, you don’t know if something is a real trend, or just a statistical blip.
That being said, if we want to give a preliminary grade to Biden’s economic performance, the best data would be inflation-adjusted earnings.
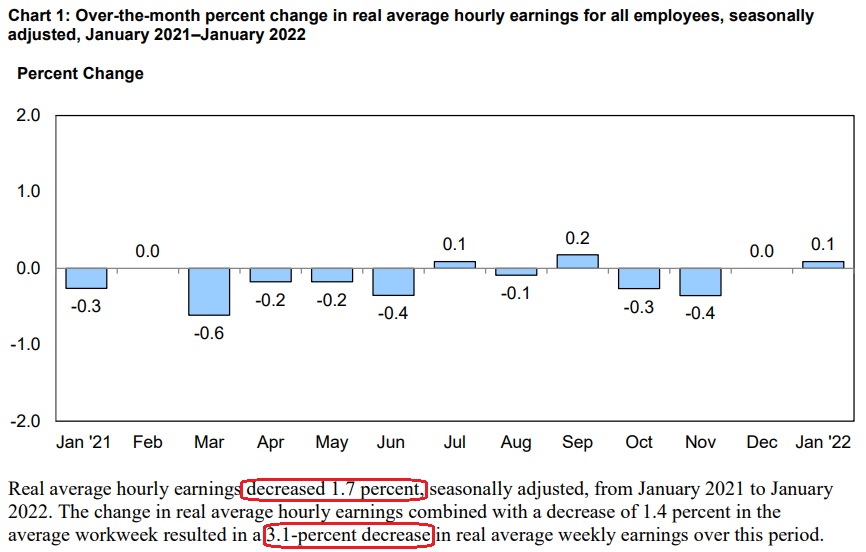
On this basis, Joe Biden is doing a bad job. Here’s Chart 1 from the Bureau of Labor Statistics’ report on what happened to hourly earnings in 2021, adjusted for inflation.
At the risk of stating the obvious, it’s not good news if most of the bars are in negative territory. I’ve also highlighted (in red) the key takeaways for the year.
Sophisticated observers will point out that hourly earnings are only one piece of the compensation puzzle.
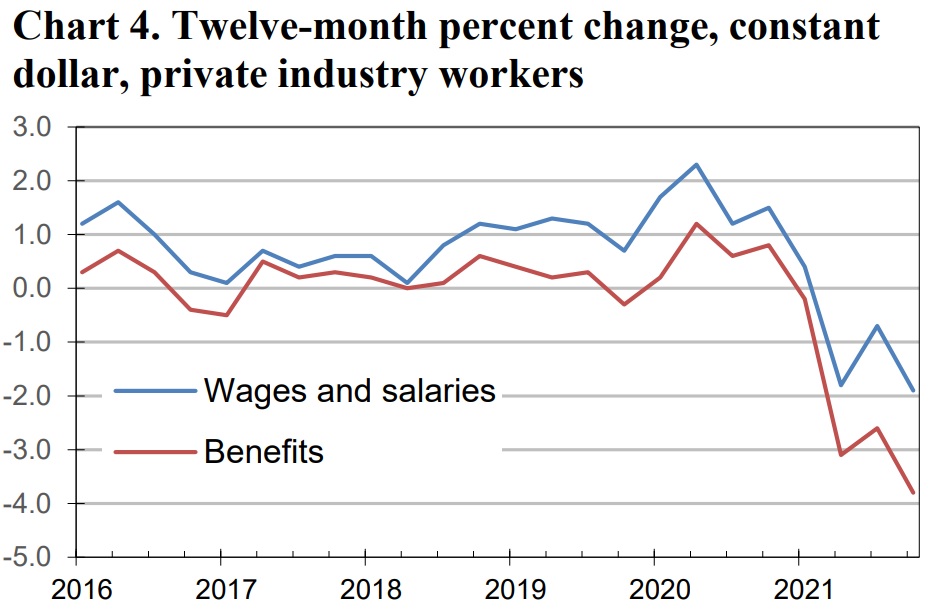
So I then went to the Bureau of Labor Statistics’ report that also includes fringe benefits.
And if you look at Chart 4, which measures compensation after adjusting for inflation, you’ll notice very depressing data for 2021.
Now that we’ve looked at some grim data, let’s contemplate whether Joe Biden deserves blame.
The answer is probably yes, but I’ll share five caveats.
- First, it’s just one year of data, so always be wary of statistical blips (maybe inflation is just transitory).
- Second, only a few Biden policies have actually been enacted (though I’m not a fan of his biggest achievement).
- Third, those policies may not have been in place long enough to have a meaningful effect on the economy.
- Fourth, keep in mind that the pandemic scrambled economic data (though perhaps in a way that should have meant a boom in 2021).
- Fifth, bad news in 2021 could merely be a continuation of a preexisting trend, in which case Trump maybe deserves blame.
Regarding the final point, notice in Chart 4 that the data was heading south at the end of 2020, when Trump was still in the White House.
Was that merely a statistical blip? If not, were the numbers bad because of something Trump did, or were they related to the pandemic? Or perhaps the bad numbers at the end of 2020 were related to investors and entrepreneurs fearing a future Biden agenda?
The bottom line is that we should ignore partisan labels and instead focus on policy. If government is becoming a bigger burden, then we can expect slower growth.
As such, it is very reasonable to think that 2021’s bad data is – at least in part – a consequence of Biden’s dirigiste policy agenda.
P.S. If he is able to resuscitate his so-called Build Back Better plan, expect more bad data in 2022.
P.P.S. For previous columns in this series, click here, here, and here.
No comments:
Post a Comment