by Blaise Vanne | Oct 27, 2021 | Climate Change, Feature 3, Politics
Editor's Note: I don't have permission to publish this in full, so if the Author takes exception I will take it down and link it. However, this piece is so profound it needs published in full with the widest possible distribution. RK
The global elite is working
overtime on the next “climate emergency,” which will be joined at the
hip with a blockchain-based “Fedcoin,” or similar. Want to buy and sell?
Get groceries? If you go over your allotted carbon allowance (same
misanthropes, no doubt, as the Covid vax doubters!), you will be cut
off. But how real is anthropogenic global warming?
One hint comes from Farley Mowat, the noted Canadian leftist and Greenpeace activist, who wrote in his book West Viking (while we were still in the global cooling scare) that there were probably at least dwarf forests growing in Greenland when the Vikings arrived in 985 AD. The Smithsonian Museum of Natural History reports,
“… Erik
the Red discovered two areas of southwest Greenland which were suitable
for farming, with grasslands and small stands of alder and birch.”
You will note, of course, that it is too cold today for any
type of forest to grow in Greenland, and there is zero ability to
farm⏤unless modern technologies are utilized. Even then, crop selection
is very minimal. Mowat also reported the Arctic pack ice was much
less in that Viking discovery era than today. Dr. Fred Singer wrote in Unstoppable Global Warming⏤every 1,500 Years that
when the Vikings first settled Greenland, they grew vegetables. It was
warm enough to allow the population to grow to 3,000 people (the Smithsonian site says the Viking population reached a zenith of 5,000 people). By 1100 AD, the place was thriving enough that they had their own bishop and twelve churches. Nature reported in a 2010 article that clamshell studies also confirm Norse records.
Meanwhile, the Archeological Survey of Canada has also noted around A.D. 1000; a warmer climate resulted in the tree line advancing 100 kilometers north of its present position.” (See Archeological Survey of Canada, Canada’s Visual History, The Little Ice and the Historic Inuit.) The results of this? Especially in northern Europe, where we have most records, the period between 1150 and 1300 was
truly a flowering period, for population reached unprecedented levels
that were never to be seen again until the late 18th century in many
countries; the English population experienced a staggering threefold
increase in its population during the last century since the Domesday
Survey in 1086.
This climate optimum coincided with a period of increased
solar activity, which is a critical element of the global warming
equation. Farming of various crops extended hundreds of kilometers
farther north than it is possible today.
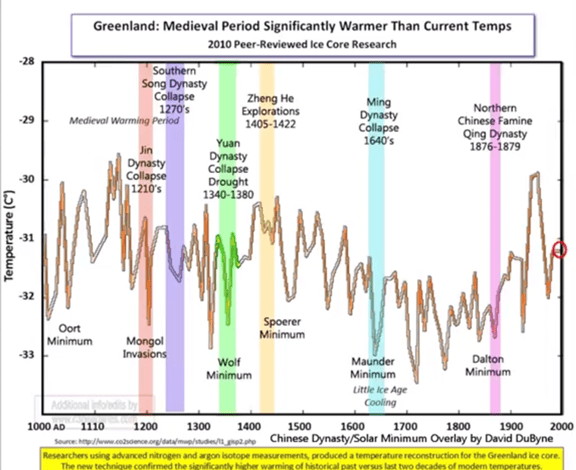
Yet, in the 1100s, Greenland cooled dramatically, briefly
stabilized, and then dropped even further in the 1200s to the early
1400s. Sirocko (2010) places the earlier event at the
beginning of the 1310s. A more commonly accepted time frame for the
first cold phase is the coinciding solar minimum called Wolf minimum
from 1280-1350, per Spektrum Akademischer Verlag, 2000, Heidelberg Lexikon der Geowissenschaften. There
were repeated cold snaps and advancing glaciers and sea ice from that
time onward, but it was not until the early 1600’s that the most
devastating effects of the Little Ice Age began to set in, which is the
more commonly used date for its beginning. As Dale Mackenzie Brown writes in The Fate of Greenland’s Vikings, in Archeology.org, An
ice core drilled from the island’s (Greenland’s) massive icecap between
1992 and 1993 shows a decided cooling off; in the Western Settlement
during the mid-fourteenth century.” The recent recovery in temperatures is only putting us back to the average temps from an earlier age!
Indeed, when I was visiting Iceland at Skaftafell Nat’l
Park two years ago, Icelandic historians know from extant Viking deeds
and have put in the displays at the park, that somewhere around FORTY
old Viking era farms are currently buried
under the Vatnajokull glacier system (the largest in the world outside
of Greenland and Antarctica). In other words, it was simply much warmer
in the Icelandic settlement era than it is today.
We are routinely informed of the melting of Greenland
glaciers today at lower altitudes, but demonstrably there are at bare
minimum low altitude glaciers in roughly the same geographic area that had seen more
melting and more pronounced glacial recession one thousand years ago
than we see today. Al Gore may want to visit Skaftafell National Park in
Iceland on one of his many jet-setting, carbon-burning trips to check
the facts himself.
There are records of grape
growing occurring in places in northern Europe back during this optimum
where they can’t grow today. Gregory McNamee, in the Weather Guide
Calendar (Accord Publishing, 2002) noted that wine connoisseurs might have gone to England for fine vintages (can’t grow fine vintage grapes there today!), that
heat-loving trees like beeches carpeted Europe far into Scandinavia,
and Viking ships crossed iceberg free oceans to ice-free harbors in
Iceland. Art Horn writes that In
the winter of 1249, it was so warm in England that people did not need
winter clothes. They walked about in summer dress. It was so warm people
thought the seasons had changed. There was no frost in England the
entire winter. Can you imagine what NOAA would say if that happened next year?
On the other side of the world, research by Panin and Nefedov in 2010
analyzed rivers and lakes in the Upper Volga, and Upper Zapadnaya Dvina
areas in Russia⏤also found evidence of a Medieval climatic optimum in
that part of the world. Even worse for the anthropogenic warmers, recent
research has found evidence for the Medieval Climatic Optimum in the central Peruvian Andes, southern South America, China, where author XJ Zhou notes temperatures in the Medieval Warm Period are comparable to those in the current warm period over China. Also,
in Antarctica, per Li, Y., Cole-Dai, J. and Zhou, L. 2009 in their
article Glaciochemical evidence in an East Antarctica ice core of a
recent (AD 1450-1850) neoglacial episode – see Journal of Geophysical Research 114: 10.1029/2008JD011091. Further evidence of an Antarctic LIA and MWP is found here.
Or you could trek north to the opposite pole, on Canada’s Arctic Ocean,
where you can see below a picture of a white spruce found on Canada’s
Arctic Ocean⏤far above today’s tree line.
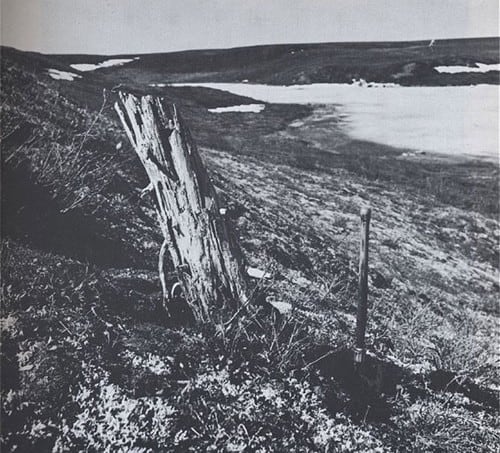
Picea glauca (white spruce) stump on the Tuktoyaktuk
Peninsula in the tundra, some 100km north of the current treeline. Photo
by Professor Ritchie (University of Toronto). The radiocarbon date was 4940 ±140 years Before Present (B.P.) and was featured in Hubert Lamb’s classic work Climate, Present, Past, and Future. Climatologist Dr. Tim Ball summarizes this here.
Similarly, two papers, reported by the Chinese Academy of Sciences, one in Earth-Science Reviews and the other in Chinese Science Bulletin, reported studies of key
chemical contents in micro-drilled giant clams shells and coral samples
to demonstrate that in the South China Sea, the warm period of the
Middle Ages was warmer than the present. The scientists examined
surveys of the ratio of strontium to calcium content and heavy oxygen
isotopes; both are sensitive recorders of sea surface temperatures past
and present. The aragonite bicarbonate of the Tridacna gigas clamshell
is so fine-grained that daily growth lines are exposed by micro-drilling
with an exceptionally fine drill-bit, allowing an exceptionally
detailed time-series of sea-temperature changes to be compiled – a feat
of detection worthy of Sherlock Holmes himself. By using overlaps
between successive generations of giant clams and corals, the three
scientists – Hong Yan of the Institute of Earth Environment, Chinese
Academy of Sciences, Willie Soon of the Harvard-Smithsonian Center for
Astrophysics, and Yuhong Wang of Fudan University,
Shanghai⏤reconstructed a record of sea-surface temperature changes going
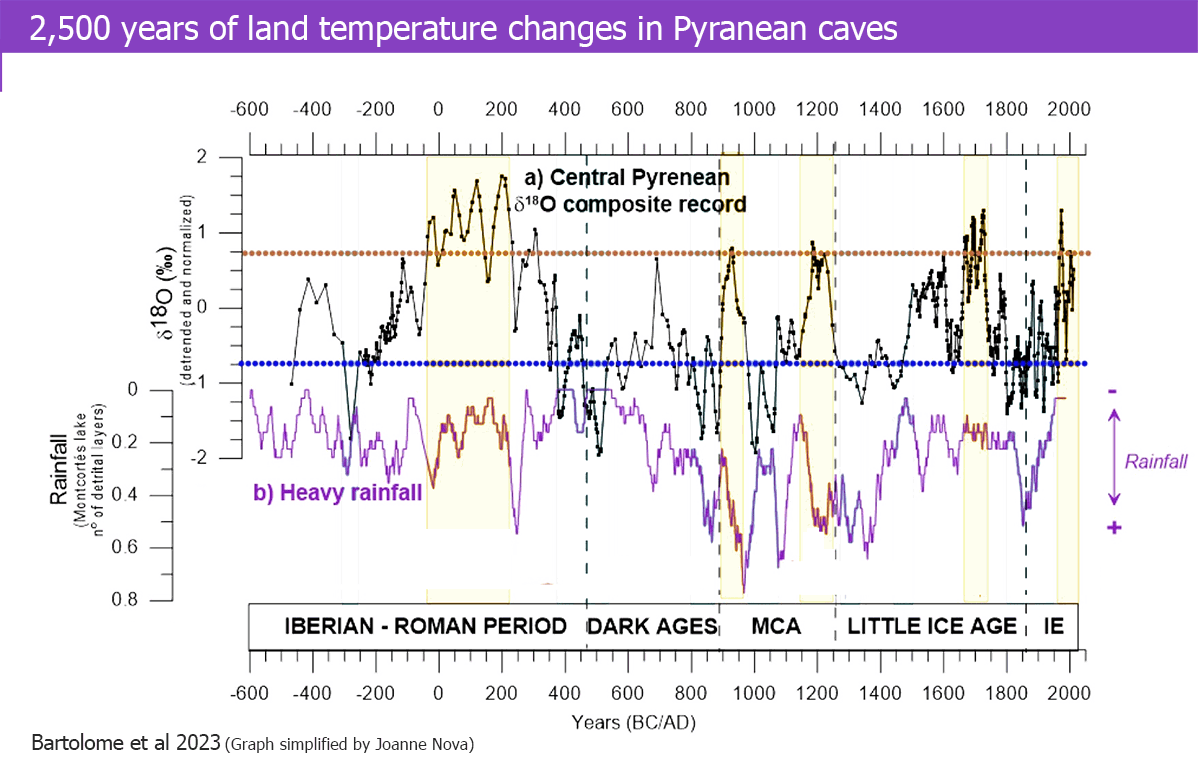
back 2500 years. The Roman and Mediaeval Warm Periods
both showed up prominently in the western Pacific and East Asia. Sea
surface temperatures varied considerably over the 2500 year period. See also here for a second story.
Dr. Soon concludes: The U.N.’s
climate panel should never have trusted the claim that the medieval warm
period was mainly a European phenomenon. It was clearly warm in the
South China Sea, too.
Another study by earth sciences professor Zunli Lu
(formerly of Oxford, then Syracuse Univ.) studied samples of crystal
called ikaite, which forms in cold water, which melts at room
temperature. Samples were taken by Lu and colleagues, examined for
variation caused by temperature fluctuations during formation, and
dated. The result? Lu writes: This ikaite record qualitatively
supports that both the Medieval Warm Period and Little Ice Age extended
to the Antarctic Peninsula. What does this mean, practically? The
MWP was not simply a localized event in northern Europe, or even the
northern hemisphere. And if it was as warm 1,000 years ago as it is now
all over the world, Al Gore is simply wrong. The details are summarized
by the UK Register here.
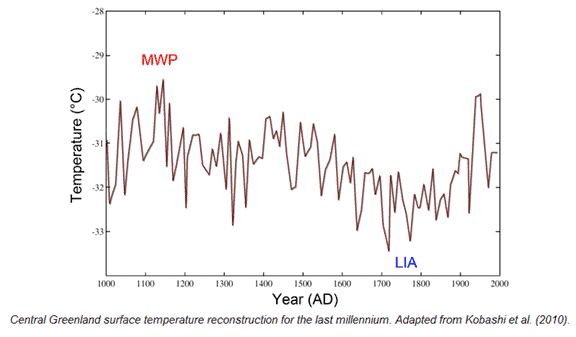
In a study by Kobashi, et al., entitled Summit Surface Snow Temperatures of Greenland, there is further corroboration of Dr. Tim Ball’s contention that the MWP was real. In sum, this study illustrated Greenland
surface snow temperature variability over the past 4000 years at the
GISP2 site (near the Summit of the Greenland ice sheet) with a new
method that utilizes argon and nitrogen isotopic ratios from occluded
air bubbles. In so doing, the eight researchers report that the average
Greenland snow temperature over the past 4000 years was -30.7°C, while
the current decadal (2001-2010) surface temperature at the Greenland
Summit is -29.9°C, which they say is as warm as it was there in the
1930s-1940s. And they add that there was another similarly warm
period (-29.7°C) in the 1140s (Medieval Warm Period), indicating that
the present decade is not outside the envelope of the variability of the
last 1000 years. Even more telling, prior to the last millennium, they
report there were 72 decades warmer than the present one, meaning
temperatures were 1.0 to 1.5°C warmer. In fact, they found that during
two intervals (~1300 BP and ~3360 BP), centennial average temperatures
were nearly 1.0°C warmer (-28.9°C) than in the present decade.
This proves without a doubt that there is nothing
unusual, unnatural or unprecedented about Greenland’s recent relative
warmth, as it is clear that much warmer temperatures have been
experienced there over many prior prolonged periods without any help
from anthropogenic greenhouse gas emissions. There is no valid reason to
believe that mankind’s burning of coal, gas, and oil has had, or is
having any measurable impact on the climate of that part of the world,
or any other part of the planet.
A similar study from Yan, Soon, and Wang concluded, from
studies of the ratio of strontium to calcium content and heavy oxygen
isotopes in corals and Tridacna gigas (giant clams), that these
warm periods also occurred in the East Asia/Western Pacific area (see
Earth-Science Reviews, Dec. 13, 2014, doi:
10.1016/j.earscirev.2014.12.003)
One further fascinating study which corroborates the MWP was a study by Belt et al. in 2007, described here, where scientists used a biomarker (IP25),
which authors Vare et al. (2009) describe as a mono-unsaturated
highly-branched isoprenoid that is synthesized by sea ice diatoms that
have been shown to be stable in sediments below Arctic sea ice. The NIPCC reports concludes: Based on IP25
data obtained from a marine sediment core retrieved from Barrow Strait
(74°16.05’N, 91°06.38’W), which they compared with complementary proxy
data obtained from analysis of other organic biomarkers, stable isotope
composition of bulk organic matter, benthic foraminifera, particle size
distributions and ratios of inorganic elements, the five U.K. scientists
of Vare et al. developed a spring sea ice record for that part of the
central Canadian Arctic Archipelago. Results
indicated evidence for a decrease in spring sea ice between
approximately 1200 and 800 years before present (B.P. which was followed
by an increase in sea ice over the last 400 years of their record
(between 800 and 400 years B.P. (emphasis mine). Even into
North America, in the first Medieval Warm Period, the Rocky Mountains
had a snow line 1,000 feet higher than today.
Research by the Chinese show similar warm periods on the other side of the world,
including one report noting in the northeast of China During the last
500 years, apparent climate fluctuations were experienced, including two
cold phases from the 1470s to the 1710s and the 1790s to the 1860s, two
warm phases from the 1720s to the 1780s, and after the 1870s. The
temperature variations prior to the 1500s show two anomalous warm peaks,
around 300 and between approximately 1100 and 1200, that exceed the warm level of the last decades of the 20th century.
Lord Christopher Monckton of England has noted, Scores
of scientific papers show that the Medieval warm period was real,
global, and up to [5 degrees Fahrenheit] warmer than now…Then, there
were no glaciers in the tropical Andes; today, they’re there (in fact,
the Perito Moreno glacier in Argentina has been expanding quite handily
the past few decades. There were Viking farms in Greenland; now, they’re
under permafrost. There was little ice at the North Pole – a Chinese
naval squadron sailed right around the Arctic in 1421 and found none. One
can infer there were warm as well as cool periods within the
centuries-long larger trend lines – clearly this was during one of the
short warm periods in the overall downward trend and the Chinese fleet
may well have sailed during one of these warmer respites. As we see even
today, there are counter-cyclical short-term trends, and not only
meteorologically, but even within areas such as stock indices). And not
only did the Chinese find little ice in 1421, 500 years later, John Coleman, founder of the Weather Channel, noted around 1900 that the Northwest Passage was clear of ice during another short period of warmth.
The fact is, the Medieval (and earlier Roman and Minoan)
Warm Periods were not just restricted to Europe, as frantic warmers try
to claim. Even former lead warmer Phil Jones of East Anglia University –
the lead location for the AGW scam – was forced to admit that there is no consensus on global warming after the ClimateGate scam came to light in 2010, stating about climate debate being settled This is not my view… There is still much that needs to be undertaken to reduce uncertainties.
Subsequent to the Medieval Climatic Optimum noted above, the
Greenland historical records show there was a severe drop in temps,
which initially started around 1100 AD, briefly plateaued, then dropped
even further through the late 1400s, only finally to sharply rise again
very roughly around 1500 (by this time the Vikings had been frozen out
of Greenland, and there were none left residing there), followed by a
precipitous fall again starting later in the 1500s to the temperature
nadirs of the Little Ice Age very roughly around the time of the
American Revolution. Importantly, each of these optimums – the ones very
roughly centered around 1000 AD and 1500 AD were far above today’s supposedly record high temperatures Al
Gore frantically is warning us about. (Meanwhile, in the global freeze
out between those two optimums, Chinese records show centuries-old
citrus orchards froze, the Thames froze up to 5′ in-depth (see Civil
Defense Perspectives, July 2001, vol 17, #5, p. 1) and James Aber writes
around 1215 in the Alps, an oberriederin (irrigation canal) was overrun by (the) advance of the Aletsch glacier; (with) the canal head still covered by the modern Aletsch glacier to this very day. Around the same time, the passage from Iceland to Greenland became impassable around the mid-1300s due to sea ice expansion, with Greenland soon abandoned.
(In this article, the author also notes in this article that skeletal
remains from Hvalsey church in Greenland show that values from tooth
enamel indicate sharply colder temperatures during this era of cooling.)
Physicist Russell Rickert has also reviewed Viking
agricultural settlements in Greenland that had to be abandoned after
1300 AD and states that there was a severe drop in temps sometime after
the MWP (the last supply ship to get through the ice was reportedly
1406, with three other ships earlier in 1381, 1382 and 1385, per Jared M Diamond, Collapse: How Societies Choose to Fail or Succeed).
Diamond noted while we don’t know precisely when the last Viking
Greenlander died, in the 1400s the North Atlantic became colder and
stormier. Any mention in Viking records of ship traffic to Greenland
ceased at that time. Diamond also noted a radiocarbon date of 1435 for a woman’s dress excavated from Herjolfsnes churchyard,
suggesting people may have survived a few years after the last supply
ship to reach Greenland. Diamond agrees that the Greenlander Norse went
through several runs of cold years in the 1300s. Then the temperatures
plunged in the 1400s, which cold lasted until the 1800s (he appears to
be speaking in broad outlines, as there were warm spikes during this
downward temperature trend).
More evidence for the MWP. France’s Burgundy region, renowned for their wines for centuries, has kept records of grape harvest data going back to the end of the Medieval Optimum,
from which researchers constructed a temperature graph which shows –
you guessed it – slight cooling overall since that era. While carbon
dioxide was as much as 100 ppm less, this research shows the 1300s,
1400, and 1600 were warmer than today.
The truth is, there has been global warming recently – but
it started around the time of the Revolutionary war, and is today still
BELOW the average of the past 3,000 years. And this is not just for
Europe, Greenland, and North America, yet another red herring that has
recently been thrown out by the desperate global warmers. The
universality of the Viking and Medieval climatic optimums is written
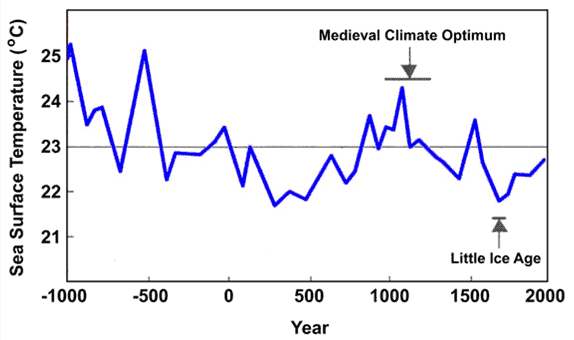
about by Kegwin, who wrote in Science, 1996:274:1504-1508, the mean
surface temp of the Sargasso Sea (which lies roughly between the West
Indies and the Azores), which was obtained by readings of isotope ratios
in marine organism remains in the sediment, shows we are, today, below the three thousand year average, and far below the Medieval Climatic Optimum. See further reports documenting this here or here. Is There Evidence for the Medieval Warm Period? This
also reviews the MWP from New Zealand through China and back to Europe –
finding it was as warm, or warmer than today. Civil Defense
Perspectives, Mar. 2007, Vol. 23, #3, p. 1, notes that evidence for this
climatic optimum has been found in all but 2 out of 103 locations where
it was examined, including Asia, Africa, South America, and the western
U.S. (See Dr. Willie Soon, et al., Energy Environ 2003; 14
(2,3):233-296 for another report on this). But the following graph of
the Kegwin research, of temperature in the Sargasso Sea, tells you all
you need to know (note: that big horizontal line running across the page
is the 3,000-year average!). Interestingly, the warmer times coincided
not only with the best harvests, but also the least amount of major
storm activity.
If you would like corroboration of Kegwin’s study, Dr. Roy Spencer has a similar chart found at www.drroyspencer.com, where he charts temperatures for the past two thousand years. Similarly, a Russian study by Dergachev and Raspopov, found, as reported in the Center for the Study of Carbon Dioxide and Global Change, that a
detailed 750-year temperature reconstruction from an ice core in
Siberia agrees well with measures of solar modulation based on sunspot
number and carbon-14 and Be-10 estimates, and that the agreement is
remarkable at multi-decadal time scales, and concluded that Dergachev
and Raspopov compare the solar indices of the past millennium with the
borehole temperature reconstructions, demonstrating that the borehole
data and solar indices agree on the long-term temperature pattern of the
past thousand years. That is to say; the two parameters imply the
existence of a solar-induced Medieval Warm Period (MWP) around AD 1000
to 1300 and a Little Ice Age (LIA) in the 1600s to 1700s. Thus, their
study pretty much proves the existence of a global MWP, while demonstrating the link between the MWP-LIA oscillation and solar activity. And
it indicates that the MWP was roughly as warm as — or possibly even
warmer than — it has been to date during the Current Warm Period. Graph for this here.
More evidence of the MWP was published in 2010, including a study by Billeaud, Tessier, and Lesueur in 2009 of the area around Mont-Saint-Michel Bay, France,
showing that the Holocene has been regularly punctuated by warming
periods, occurring every 1500 years, +/- 500 years. The MWP also existed
in Central Asia, as summarized by the NIPCC of an article by Chen, et al. Moisture changes over the last millennium in arid central Asia: A review, synthesis, and comparison with monsoon region, published in Quaternary Science Reviews 29: 1055-1068.
Even the Chinese are in on the act: CM Ma, et al., analyzed multi-proxy data, including, in their words, “14C, grain size, microfossil, plant seeds, and geochemical elements
— which they obtained from sediment retrieved from excavations made in
the dry lake bed of Lop Nur China’s West Lake (40°27’129″ N, 90°20’083″
E) — in order to amply discuss, as they describe it, the climate and environment changes during the MWP (Medieval Warm Period), which they identified as occurring between AD 900 and 1300. So what did they find?… Ma, et al. conclude that ‘the environment was the best…temperature was almost the same [as] or a little higher than [italics added] nowadays.”
Once again, one can see that Mr. Gore and his green
minions have confused the emergence from the mini-ice age with
anthropogenic global warming.
In case you need yet more evidence of the Medieval Climatic Optimum, the NIPC.org cites a study by Kobashi et al. (2010) wherein Greenland, oxygen isotopes of ice (Stuiver et al.,
1995) have been extensively used as a temperature proxy, but the data
are noisy and do not clearly show multi-centennial trends for the last
1,000 years in contrast to borehole temperature records that show a
clear ‘Little Ice Age’ and ‘Medieval Warm Period’ (Dahl-Jensen et al., 1998).” However, they note that nitrogen (N) and argon (Ar) isotopic ratios — 15N/14N and 40Ar/36Ar, respectively — can be used to construct a temperature record that is
not seasonally biased, and does not require any calibration to
instrumental records, and resolves decadal to centennial temperature
fluctuations.” And what does this study by Kobashi, et al., show? See for yourself:
In Italy, at the NIPC reports, Working
with stalagmite SV1 from Grotta Savi — a cave located at the southeast
margin of the European Alps in Italy (45°37’05” N, 13°53’10” E) — Frisia
et al. (2005) developed a 17,000-year record of speleothem calcite δ18OC data, which they calibrated against “a reconstruction of temperature anomalies in the Alps” that was developed by Luterbacher et al. (2004) for the last quarter of the past millennium.”
This work clearly shows that between the Roman Warm
Period and the Medieval Warm Period, there was a cold period, but at
least during with MWP, it was as warm as, if not warmer, than today. And
I am pretty sure Al Gore and his green fasco-Marxists cannot blame that
on Medieval SUVs, though perhaps that will be next in the fake news.