Search This Blog

De Omnibus Dubitandum - Lux Veritas

Showing posts with label Weather. Show all posts

Thursday, August 10, 2023

The Real World Costs Of Backing Up Weather-Dependent Electricity Generation With Battery Storage

August 8, 2023  @ Manhattan Contrarian 

A recurring question at this blog has been, how do the world’s politicians plan to provide reliable electricity without fossil fuels? Country after country, and state after state, have announced grand plans for what they call “Net Zero” electricity generation, universally accompanied by schemes for massive build-outs of wind and solar generation facilities. But what is the strategy for the calm nights, or for the sometimes long periods at the coldest times of the winter when both wind and sun produce near zero electricity for days or even weeks on end?

When pressed, the answer given is generally “batteries” or “storage.” That answer might appear plausible before you start to think about it quantitatively. To introduce some quantitative thinking into the situation, last December I had a Report published by the Global Warming Policy Foundation titled “The Energy Storage Conundrum.” That Report discussed several calculations of how much energy storage would be required to get various jurisdictions through a year with only wind and/or solar generation and only batteries for back-up, with fossil fuels excluded from the mix. The number are truly breathtaking: for California and Germany, approximately 25,000 GWh of storage to make it through a year; for the continental U.S., approximately 233,000 GWh of storage to make it through a year. At a wildly optimistic assumption of $100/kWh for storage, this would price out at $2.5 trillion for California or Germany, $23.3 trillion for the U.S. — equal or greater than the entire GDP of the jurisdiction. At more realistic assumptions of $300 - 500/kWh for battery storage, you would be looking at 3 to 5 times GDP for one round of batteries, which would then need replacement every few years.

But even these numbers wildly understate the real world costs of storage that would be needed. Here’s why: the calculations that I presented were based on actually data for particular years, and what storage would have been needed to make it through that year. For example, here is the chart from my Report of the annual charge and discharge cycle for a collection of batteries that would have been sufficient to get California through the year 2017 on a wind/solar system, fossil fuels eliminated, without running out of electricity:

As you can see, the calculation assumes that California would run its batteries right down to zero in March with the expectation that they would then begin to recharge.

But if you are planning a system that must have 99.9% reliability, you can’t just look at one year and assume you can run your storage down to zero. You need to consider the worst-case year. This is particularly true in the case of an electricity system consisting only of wind and solar generation plus batteries. If the batteries run down to zero, then what? It is not at all obvious how to restart. You might need to dedicate the generation exclusively to charging the batteries for weeks or even a month or more before you can have confidence that you can restart without immediately crashing again.

So, in the real world, how would you run such a system prudently?

There actually exists a closely analogous type of system from which we can make inferences of what kind of margins are necessary to assure reliability. That analogous type of system is the system for water supply. The supply of water from a reservoir system, like generation of electricity from wind and sun, is dependent on unpredictable weather. What kind of margins for storage are necessary to assure reliability?

The New York City water supply system makes lots of data available to investigate this question. Here are some key data points:

  • New York City consumes about 1 billion gallons of water a day from its reservoir system. (Although the population has grown somewhat over the past couple of decades, that figure has remained quite stable, and actually decreased by a little, largely due to universal metering and increasing prices.)

  • The New York City reservoir system has a capacity of approximately 550 billion gallons — which is about 1.5 years of consumption, or 18 months’ worth.

  • Rainfall, on average, is a generous 4 inches per month, year-round. However, there can be droughts, which can continue for months on end.

The New York City reservoirs have a usual annual cycle. Usage exceeds replenishment in the summer and fall, and then the reservoirs refill in the spring with run-off from melting winter snows. In a typical year, the reservoir level never falls below 70% of capacity. However, there are periodic drought years, when reservoir levels can get much lower.

Here is a chart from New York City on historical droughts going back to the 1960s. There were droughts in 1963-65, 1980-82, 1985, 1991, 1995, and 2002. The lowest level reported for the reservoirs in this chart occurred on January 19, 1981, when the level reached 33% (which would represent approximately 6 months of usage). A drought “Emergency” was declared at that point. Another “Emergency” was declared in April-July 1985, with the reservoir level ranging between 55% and 62% (10-11 months of average usage), and again in April 2002 with the level at 57.5% (10 months average usage).

I would contend that this represents government over-reacting as usual and trying to scare the people into compliance. All of these drought conditions resolved themselves when rains came and refilled the reservoirs long before they emptied out.

But the point remains: Nobody is going to let the reservoirs get anywhere close to zero before declaring an emergency. After all, there is no further back-up when the reservoirs are empty. At that point, there is no more water until some rain shows up. And so we consider it a drought emergency when the remaining storage is somewhere in the range of 6 to 10 months of water.

Now apply that to a prospective wind/solar/battery electricity system with fossil fuel back-up eliminated. Are we really going to run such a system in accordance with the models in my Report, where we allow the batteries to drain right down to zero every spring? What if the wind and sun don’t cooperate for the next month (or two, or three)? Won’t we insist on having at least a month’s worth of spare storage at the normal low point of the year, just in case we have a worst-case situation?

In that case, I suggest that the number presented in my Report for the cost of batteries to back up a fossil fuel-free system are low by at least a factor of two, and probably more.

Wednesday, August 2, 2023

Democrats Blame Republicans for the Heat

By August 01, 2023 @ Sultan Knish Blog

 “Hot enough for you? Thank a MAGA Republican. Or better yet, vote them out of office,” Hillary Clinton tweeted.

The compulsive liar and failed presidential candidate who dodged multiple investigations into everything from trading cattle futures to mishandling classified information does know a few things about beating the heat. That’s why the Clintons used to “borrow” vacation homes from understanding campaign donors like a real estate developer whom Clinton named an ambassador to Switzerland and then had him buried in Arlington National Cemetery before he had to be dug up again and reburied when it turned out that instead of being on a ship that had been hit by a German torpedo, the war hero was actually going to college classes in Chicago.

Democrats could stop lying all the time or they could promise to save us from the weather.

Blaming your political opponents for the weather is not a new idea. Hillary’s predecessors during the Salem Witch Trials accused a woman of having caused “such a violent storm that we lost our main mast and rigging”. Any day now, Hillary will also accuse conservatives of curdling the milk, flying through the air and bewitching Americans into finding her unlikable.

Democrats are blaming Republicans for the heat while promising to fix it with lots of cash.

The “Extreme Heat Emergency Act” would treat heat as a natural disaster. Next up, cold will be a natural disaster. And then once temperature has been redefined as a natural disaster, much of the country will be a permanent natural disaster site and eligible for non-stop disaster relief.

Also coming is the “Stay Cool Act” because while Congress can’t fulfill any of its actual responsibilities, it can only do the things no one can do like changing the weather.

Extreme heat is hot in Washington D.C. right now. That’s a city where all the politicians used to flee over the summer long before anyone had coined the ‘global warming’ hoax. Even many of the Constitutional Convention delegates absconded from Philly once the summer heat kicked in.

Summer has always been hot. Before air conditioning those who could fled cities for the country and those who couldn’t, slept on fire escapes or in bathtubs. The only thing that made D.C. livable (assuming that it is livable) was the invention of air conditioning. But Dems would like to take away our conditioning while promising to save us from “extreme heat”.

Joe Biden, fresh off from announcing that he had “ended cancer as we know it”, promised to spend $150 million to protect Americans from “extreme heat”. That’s enough to buy 1 million air conditioners which could significantly cut down heat-related deaths. But the Biden administration isn’t doing that, instead it’s trying to ban air conditioners.

“For years, heat has been the — I have to admit I didn’t know it either. I thought it — I knew it was tough, but the number one weather-related killer is heat. The number one weather-related killer is heat. Six hundred people die annually from its effects,” Biden mumbled.

600 deaths isn’t bad. 15,000 people died in a heatwave in France. Only 5% of French households have air conditioners because they’re “bad for the planet.”

Thousands of people dying however is good for the planet.

That’s why Biden is cracking down on air conditioners, along with cars, gas stoves, and freedom of speech. The push for more “energy efficient” air conditioners will make them less affordable and hit poor people hardest. Those are also the people likeliest to die when it gets hot.

“Air-conditioning can and should be deployed as a tool for survival in extreme circumstances to the populations who need it. But the current reality is that most AC is still used by those who are least vulnerable in times that are far from extreme,” a Time article complained. “In 2016, 328 million Americans—that’s less than 5% of the world’s population—guzzled more energy for cooling than the 4.4 billion people living in all of Africa, Latin America, the Middle East, and Asia.”

So Biden won’t be handing out a million air conditioners. Instead he claims that “the Department of Housing and Urban Development is providing billions to communities to make buildings more efficient and to make more heat — make them more heat-resistant, opening cooling centers in — for residential areas and in the cities that the communities can go to to be safe.”

Cooling centers are common in French urban areas and thousands of people still die. Opening the equivalent of homeless shelters for air conditioning while pricing air conditioners out of the reach of working class people is no solution to anything except killing off the poor.

One study showed that air conditioning cut premature deaths on hot days by 80%.

Deaths directly caused by heat were twice as high in 1980 as they are today. That’s the year over 1,000 people died. So much for the increasing doom trend of global warming.

But according to Biden and Hillary Clinton, Republicans are causing the heat.

“MAGA extremists in Congress are trying to undo all this progress,” Biden ranted. “Not a single one of them — not a single Republican voted — voted for the Inflation Reduction Act, which had all this money for climate, which provides funding to con- — to combat climate change.”

The Inflation Increase Act did spend billions on the IRS and climate chargers for Tesla. Maybe Biden can explain how more IRS agents and electric car chargers for the rich will cool us off.

“As Americans Face Extreme Heat, MAGA Republicans Still Ignore Climate Change,” the DNC complains. The climate isn’t changing, it’s cycling. That’s what climates do. The political climate in D.C. cycles between corruption and outrage, and between claiming that we’re all about to freeze or fry and that only politicians who can’t stop stealing will save us from the weather.

“I don’t think anybody can deny the impact of climate change anymore,” Biden insisted.

Biden, as the owner of a beach house, obviously believes in climate change. That’s why he bought the Rehoboth Beach located in a flood zone in 2017 for nearly $3 million.

Either Biden is a bad investor or a bad liar.

Politicians like Biden and Obama who believe in global warming have a lot of beachfront property. And they can’t seem to stop buying the homes that they claim are doomed. They vow that they can save us from the weather, but what we really need saving from is them.

If you’re in a hot room where the temperature is stifling, the air tastes like molasses and you’re coated in so much sweat that the furniture is mildewed, don’t buy a politician, buy an air conditioner.  

Daniel Greenfield is a Shillman Journalism Fellow at the David Horowitz Freedom Center. This article previously appeared at the Center's Front Page Magazine. Click here to subscribe to my articles. And click here to support my work with a donation. Thank you for reading.

Monday, August 15, 2022

The Hot Pagan Nights of August

By On August 14, 2022 In  

"On summer nights, star of stars, Orion’s Dog they call it, brightest, of all, but an evil portent, bringing heat, and fevers to suffering humanity," Homer lyrically described it in The Iliad.

The ancient Greeks believed that heat waves were caused by heat from Sirius: the dog star. We postmoderns don’t believe in any silly superstitious nonsense like that knowing all too well that the ‘dog days of summer’ are caused by Styrofoam containers and a lack of carbon taxes.

To bring attention to this urgent crisis, the Spanish city of Seville, the Spanish Office for Climate Change and the Atlantic Council’s Adrienne Arsht-Rockefeller Foundation Resilience Center, decided to start naming heat waves. This one was named “Zoe”, which was how assimilated Alexandrian Jews in Egypt rendered “Chava” or “Eve”: meaning the mother of all life.

Postmoderns are also too smart to believe in the Bible or the story of G-d creating the world. They know that the world emerged accidentally out of chaos and is always on the verge of being destroyed by mankind. Instead a foundation under the aegis of CIA officials, named after a leading oilman and the widow of JFK’s premier opposition researcher will name the heat.

To pagans, the minutiae of the natural world, heat and cold, the position of the stars, were the revealed religion that they could experience. Postmodern pagans feel the same way. Global warming is the old pagan climate religions, the worship of rain and sun, tree and wave, animal and earth, not out of a desperation to survive, but a spiritual void in a culture that has lost its moral capacity.

Naming the heat and blaming it on man’s sinful refusal to appease the natural forces by abandoning his technology is a postmodern paganism that sees summer heat as an ill portent. What we lack in the arts of a Homer, we more than make up for in a panicked bureaucracy.

According to the European Union’s Copernicus Climate Change Service, every year is the warmest year on record and this is no exception though one might query the hippos whose skeletons were found in the Thames and the lions who roamed where London now stands, the remains of elephants have been found in Seville, and giraffes lived in Italy long before Caesar brought one over and the Romans took to eating the long necked creatures as a delicacy.

Europe tried to stop global warming by abandoning its domestic energy capabilities, turning to solar and wind energy, and when that failed, to Russian gas delivered through Ukrainian pipelines. The resulting war between the two countries has now lasted over 150 days and one can only imagine how much heat the destruction of cities and the endless bombing has unleashed.

One of the things that the ancient Greeks understood that the modern greeks don’t is hubris.

Much has been made of 'Zoe' giving Seville whopping 110 degree temperatures, or what Arizonans call mild summer weather, but the intemperate Spanish city hit 116 in August 1946, and 123.8 in 1876. The latter, like most temperature records made before Earth Day, has been withdrawn for its heretical implication that there were any hot days before the advent of Al Gore.

Weather is as much an art as science. It has objective measurements, but subjective experiences.

“This is a bad country, this America, where you always have to drink, either to get warm, or to get cold,” a Hessian mercenary fighting against Americans during the War of Independence complained.

A more contemporary European visitor, French Ambassador Philippe Etienne, arrived recently in Alaska and began by opining, "We had just, in Europe, two heat waves already this summer... So it’s really important for all of us in the world, reaching our goals, limiting the global warming."

If you’re going to limit global warming, Alaska would be the place to start.

Back in Europe, the Globe Theater, which has gone both woke and broke, marked Earth Day with "Shakespeare and Climate Emergency", examining the works of the Bard through climate panic, or the other way around. We are told however that Shakespeare "would have had no conception of the scientific link between emissions and climate change."

That seems unlikely considering that he wrote of “a tale told by an idiot, full of sound and fury, signifying nothing.” Shakespeare’s monarch was not apt to spend billions paying researchers to claim that the sky is falling unless everyone takes to biking to work and eating soy patties.

But apocalyptic scams were nothing new even in his time.

That was the era when the Prophetia Merlini or prophecies of Merlin, mostly forgotten today, were still seen by some as predicting the future. “Oak trees will burn in the forests and acorns will grow on the branches of lindens. The Severn estuary will flow through seven channels and the river Usk will boil for seven months. The heat will kill its fish and snakes will take their place.”

“Sometimes he angers me with telling me of the moldwarp and the ant, of the dreamer Merlin and his prophecies,” Shakespeare comments in Henry VI. “And such a deal of skimble skamble stuff.” The skimble skamble stuff of dreams is all around us now. In the hot noonday sun where only mad dogs and Englishmen walk, climate prophets cry, “Doom” and do BBC interviews.

Bill McGuire, a British academic who blogs for the eco-terrorist group Extinction Rebellion who have taken to glueing themselves to things like Oxford Circus, the Science Museum and the European Commission headquarters, has a new book out, “Hothouse Earth”.

"There is now no chance of dodging a grim future of perilous all-pervasive, climate breakdown," he declares in a book that will be out in paperback for only $16.95.

This follows up on his 2002 book, "A Guide to the End of the World" looking at the "frightful prospects that await us in the 21st century" and "Surviving Armageddon" from 2005 about "massive earthquakes and super-eruptions, collision with vast boulders from space."

Now this is the sort of skimble-skamble stuff to set off idiots gluing themselves to things.

“This is a call to arms. So if you feel the need to glue yourself to a motorway or blockade an oil refinery, do it. Drive an electric car or, even better, use public transport, walk or cycle. Switch to a green energy tariff; eat less meat," McGuire raves.

Notably he leaves off suggestions about environmentalist nutters gluing themselves to bookstores selling his book or interrupting his speaking engagements the way that they seem to have taken to gluing themselves to classical works of art. He urges fans to order his book at local bookstores and kill some trees and emit some fumes, instead of buying it on Kindle.

The end is always near. And from the earliest literature of mankind, it makes for good book deals. Zoe will be the first of the named heat waves sponsored by the Rockefeller Foundation. Any ambassadors from Paris or barbers from Seville who fly to Alaska will be deemed climate refugees and allowed to move into igloos. The heat waves of summer will give way to the storms of the fall and the snowfalls of winter. And all will be heralded as climate change.

People with nothing to believe in must turn to something. They find ill omens and portents, conspiracy theories and rumors, they bow down and worship the earth and the sun.

It’s far more appealing than turning to G-d.

But as Shakespeare wrote, "The day is hot, and the weather, and the wars, and the King, and the Dukes; it is no time to discourse."

Daniel Greenfield is a Shillman Journalism Fellow at the David Horowitz Freedom Center. This article previously appeared at the Center's Front Page MagazineClick here to subscribe to my articles. Thank you for reading.

Tuesday, July 26, 2022

What Greens don't get about volcanoes, oceans, and weather

Despite Green propaganda, recent Australian floods were not caused by coal, cattle, or cars.  Weather is driven by winds; solar energy powers the winds and draws moisture for them from the oceans.  These eternal natural rain-making processes have been aided recently by two extra factors. Firstly, a big La Niña weather event in the Pacific Ocean has left warmer water closer to Australia. Secondly, there is increased underwater volcanism in this region, as evidenced by the volcanic eruptions near Vanuatu.

Earth's climate history is written in the rocks.  Anyone who cares to read that record will see that recurring Ice Ages, not global warming, pose the greatest threat to life on Earth.  Even in today's warm Holocene Era, the Little Ice Age was a time of war, famine, and distress, whereas the Medieval Warm Period heralded a time of peace and plenty.  Earth's weather is driven by winds powered by convection currents, which get most of their energy from the sun........To Read More....

Tucker Carlson targets up a serious, dangerous crisis in American science - Over the last few years, and with increasing emphasis in the last few weeks, we are learning that medicine and other science in America are deeply corrupt. 

Monday, July 25, 2022

More Evidence of the Pointlessness of Wind and Solar

This essay by David Stevenson of the Caesar Rodney Institute Center for Energy & Environment appeared in May, but I just ran across it today. It analyzes data from the PJM electrical grid, America’s largest, between 2019 and 2021.

This comparison of actual regional grid carbon dioxide (CO2) emissions between 2019 and 2021 shows increased use of wind and solar did not reduce emissions. Wind and solar electric generation are actually poor technologies no one would use without permanent government mandates and massive subsidies and taxes that are adding $1 billion a year in power cost. They are also unreliable, non-recyclable, have negative environmental impacts, have shorter productive life spans than alternative power sources, and take up a lot of ground. If it doesn’t reduce carbon dioxide emissions why are we using wind and solar?.................More Evidence of the Pointlessness of Wind and Solar


Saturday, January 2, 2021

Weather made (sort of) understandable: The primary elements: Water, land, and air

 By , | December 23rd, 2020 | Climate | 6 Comments

THE STRANGE PHYSICAL ASPECTS OF WATER

As we did in Parts One and Two of this series on weather, we shall start with what may be a shocking exclamation. Weather is nothing more and nothing less than nature trying to equilibrate the balance of all energy transmitted to the Earth by the Sun. It is a never-ending multi-level show of physics trying to overcome imbalances and irregularities too numerous to quantify accurately. Yet, we try hour after hour and day after day all across the Earth.

WATER

Water is the only substance that is capable of reversing density direction as a function of temperature. What does this mean? Like all other substances, water shrinks and gets denser as it gets colder. But unlike most materials, when water reaches about 4.0 C, the direction changes. As it gets colder and colder, it starts to expand, and the volume increases. That’s why we see ice on top of the waters and not at the bottom, and it’s why we see the tips of the icebergs float at the top of the seas. Those icebergs are about 10 percent less dense than the water they float on, and why 90 percent is below the water level. “So, what?” you might ask.? The so what” is enormous! The most dominant factor is that if the ice formed and fell to the bottom of the oceans, there would be no fish in the world and no amphibians to crawl onto land and form other creatures.

Conversely, if the warm water did not rise and stay at the top 100 meters or so, it may not have been possible for phytoplankton to grow and prosper. Trees, plants, and grasses only produce about 30 percent of the planet’s Oxygen, whereas the planktons and other marine vegetation produce 70 percent of the Earth’s Oxygen.

Also, warmer water holds less dissolved gasses than colder water, and the colder it gets, the more it absorbs. We see this in our everyday experience. When we open a cold bottle of soda, carbon dioxide bubbles out. When we let the soda warm up while open, the Carbon dioxide comes out naturally, leaving it flat.

A fish like a trout or arctic char that needs more Oxygen than a carp is more likely to live in the colder waters and the carp in the warmer waters. This temperature difference rewards the more adventurous fish who braved the move to the colder waters with more Oxygen and more plankton, and more food sources.

This change in water temperatures allows the Earth to modulate the amounts of gasses in the air vs. in the water. The oceans will release more CO2 into the air to support the growing biomass that comes with warmer periods. Conversely, when it gets colder, the oceans reabsorb the CO2 because plant life has slowed down, and it saves the excess CO2 for when it cyclically warms back up.

LAND

Land includes our lawn and farmland and mountains, you and the seals in the north and penguins in the south pole and the grasslands in Argentina and mountains of Peru and Canada’s trees. Land heats very differently than water and air. The ground reflects very little of the Sun’s rays to outer space. That’s one reason why land heats up faster than water. Most of the heating of land and oceans is by visible light and IR and some extreme UV (EUV). On the beach, infrared is why you feel warm, and your skin burns, and UV is why you get sun blisters. Land absorbs heat very quickly but does not store heat as long as the oceans do, losing it just as fast. On land, the energy keeps getting absorbed until night comes. Then the warmer ground starts losing the heat back to the cooler air, mostly by radiation and a little by convection. This radiation keeps going up through the atmosphere during the night. When these rays reach the sky and clouds, some are absorbed (greenhouse effect), and some of the radiation goes directly into outer space.

Next, we find that not all land is created equal. Some materials, like asphalt and rocks and bricks and cement and buildings and streets, absorb more heat and faster and retain it longer than grasslands and wetlands and trees. This ability to retain heat contributes to weather and climate changes in the form we call” the urbanization effect.” This urbanization effect can add as much as 2 or 3 or even 4 degrees Celsius in major urban areas compared to farmlands just a few miles away. Las Vegas is probably the best example. So, if you are a weatherman or a climatologist, this means that you must be very careful where you put your earth-based thermometers to make sure you don’t create wrong temperature profiles or trends.

AIR

The air is a very fluid mixture of many different gasses and many other aerosols, dust, and water vapor. Primary gasses include 78 percent nitrogen, 21 percent oxygen, and 0.04 percent carbon dioxide (CO2). This does not include the water vapors and aerosols that help make up clouds. The water content in the clouds can be minimal and wispy at the higher regions or form much more prominent and more massive clouds in the lower areas. Cloud properties are challenging to measure, quantify, and model.

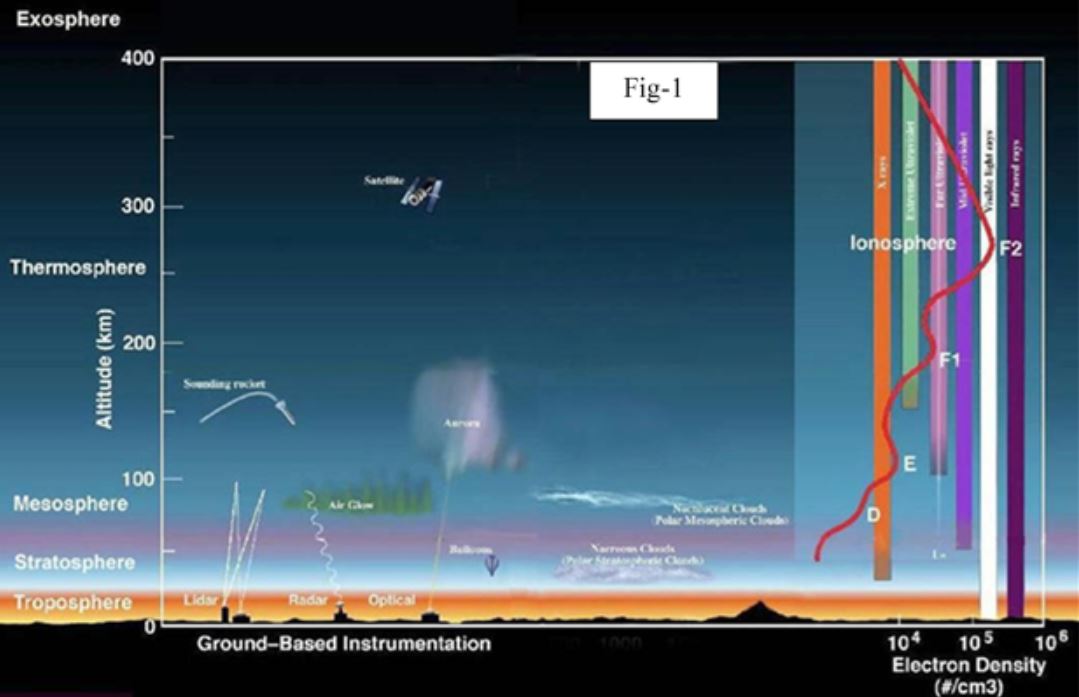
As seen in Figure – 1, five layers are going up in the atmosphere from sea level to more than 600 kilometers.

These layers are very fluid and will change in different ways depending on what’s pushing or pulling them around, like the Sun’s heat, solar winds, and pressure differences. The exosphere is the highest layer at over 600 km. The air is thin and made mostly of hydrogen and helium, and it gradually fades into the vacuum of outer space. The troposphere is the layer directly above the Earth, where most of the clouds are and where most of the weather actions occur.

Weather made (sort of) understandable: The primary elements: Water, land, and air 1

WATER VAPOR

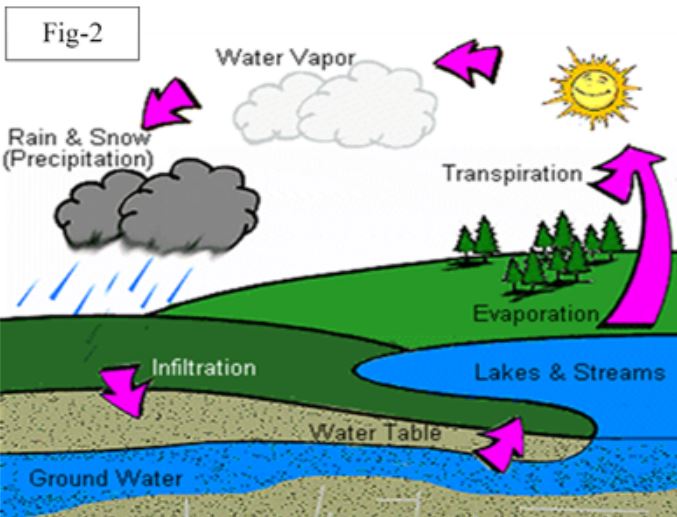
Figure 2. plays a crucial role in the Earth’s water cycle and is an absolute necessity in the Earth’s ability to sustain all life; plants, animals, birds and fish, trees and whales, polar bears,

 Weather made (sort of) understandable: The primary elements: Water, land, and air 2

etc. In the simplest of terms, the Sun heats the waters and forms water vapors that rise into the air. At some altitudes and temperature and barometric pressure, some of these tiny water vapor elements will meet up with an aerosol particle. The aerosol may be a dust particle from a volcano or farmland or industrial pollutant or a car or jet or whatever, and they become the seed around which the water vapor starts to condense and stick. An example of this can be seen in the sky as long cloud streaks behind a high-flying jet. Those white streaks are not smoke, and they are not pollution. They are clouds forming around the release of the aerosol by the jet engines and the water vapor sticking on them.

As more and more water vapor sticks to these seeds, they grow bigger and bigger, and more and more of these seeds accumulate water vapor until a cloud is formed. This natural process is called nucleation.” The clouds keep getting bigger and bigger as more and more of these droplets are created. The cloud also becomes more substantial and more massive as each of these condensed water vapor droplets keeps getting bigger and bigger. At some point, when enough of them are big enough, it starts to rain or snow. As the rain droplets fall down the sky towards Earth, they will hit the ground as rain if it’s warm enough. If it’s a little bit cooler, it may come down like hail, or if it’s icy, it will be snow. This water is then spread across the land and seas. The plant life absorbs some, and some end up in rivers and lakes and seas and oceans, and the cycle starts again.

VOLCANIC ERUPTIONS

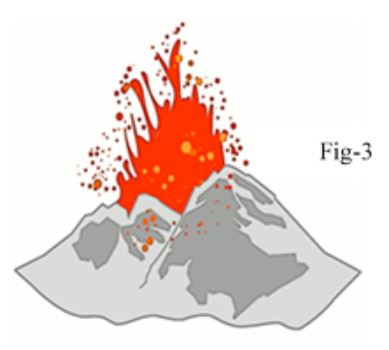
Figure 3 Volcanic eruptions play a substantial role in weather change because they provide the 

Weather made (sort of) understandable: The primary elements: Water, land, and air 3 

cloud seeding aerosols contributing to increased cloud formation. The dust and pollution gasses will form a barrier that shields the Sun’s rays and will cool the Earth. When there’s a massive eruption, these clouds can cover vast areas and last for months and may destroy a year’s worth of agriculture in the affected areas.

One such example occurred in 1816, known as the Year Without a Summer,” due to the eruption of Mount Tambura in Indonesia. This super-eruption had mass ejections of billions of tons of dust, gasses, and aerosols into the atmosphere. This eruption significantly reduced the amount of the Sun’s energy from reaching the Earth, causing the average global temperature to decrease by 0.7–1.3 ° F. And huge failures of agriculture.

Weather made (sort of) understandable: The primary elements: Water, land, and air 4 

EARTH’S LATITUDES

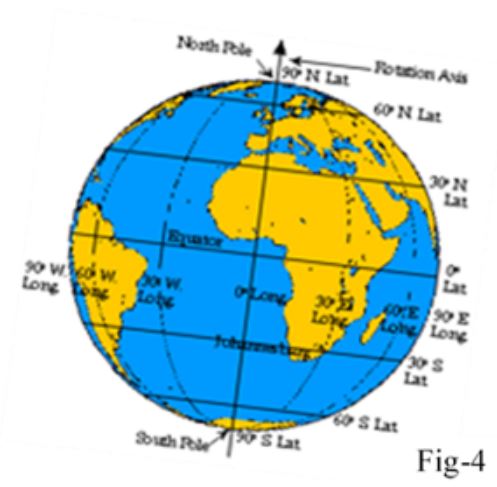
See Figure 4. Regarding both weather and climate, where you live matters, and it matters a lot! If you live in the tropical areas, close to the equator, it’s where the Sun’s rays more directly reach the planet. As a result, it’s hot and generally much more humid. That’s far different from the colder temperate zones, and as you move away from the equator, north or south, the further you go, the colder it gets, and really – cold as you go closer to the north and south poles.

EARTH’S THERMAL BLANKET

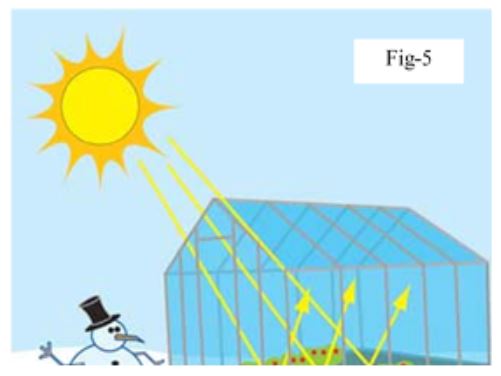
Figure 5. The greenhouse effect is an excellent benefit for the Earth. It’s the blanket that helps 


 Weather made (sort of) understandable: The primary elements: Water, land, and air 5

keep us in the Goldilocks zone by preventing more heat from escaping at night than it gets from the Sun during the daylight hours. Ninety-five percent of this greenhouse effect is due to the water vapor content in the air. The other five percent is contributed by the so-called “greenhouse gasses, where CO2 is the second-largest contributor, methane is the third, and other gasses fill in the balance.

By now, of course, dear reader, you realize that we have at best “sort of” made weather a little more understandable. But what we are sure of is that you have a better understanding of the complexity of weather and an appreciation of all-weather experts’ work and why predictions a week out are difficult. Perhaps also you will realize how silly predicting the Earth’s temperature decades from now.

Portions of this article are excerpted from the 2020 book A HITCHHIKER’S JOURNEY THROUGH CLIMATE CHANGE by Terigi Ciccone and Dr. Jay Lehr. The book is the best source for parents and grandparents to explain climate change reality to their children.  It’s especially recommended for young teens and Gen-Z as they will bear the consequences of climate change folly. 

Available from Amazon at https://www.amazon.com/Hitchhikers-Journey-Through-Climate-Change-ebook/dp/B086R49RS6 In kindle, black and white paperback and large format full-color figures. Or send an email to terigiciccone@gmail.com.

Author

  • CFACT Senior Science Analyst Jay Lehr has authored more than 1,000 magazine and journal articles and 36 books. Jay’s new book A Hitchhikers Journey Through Climate Change written with Teri Ciccone is now available on Kindle and Amazon.

  • Engineer, Science Enthusiast and Artist. Loves reading and travel, Naturalist, Author of the new book “A Hitchhiker’s Journey Through Climate Change.”

Thursday, December 31, 2020

Fascinating variations — Weather made (sort of) understandable: Part Two

Weather is nothing more and nothing less than nature trying to equilibrate the balance of all energy transmitted to the Earth by the Sun.

 By , December 16th, 2020 @ CFACT

As we did in Part One of this series of essays on the weather, we shall start with what you may believe is a shocking exclamation. Weather is nothing more and nothing less than nature trying to equilibrate the balance of all energy transmitted to the Earth by the Sun. It is a never-ending multi-level physics show trying to overcome imbalances and irregularities too numerous to quantify accurately. Yet, we try hour after hour, day after day, all across the Earth.

Fascinating variations -- Weather made (sort of) understandable: Part Two

TEMPERATURE AND LOCALIZED DIFFERENCES

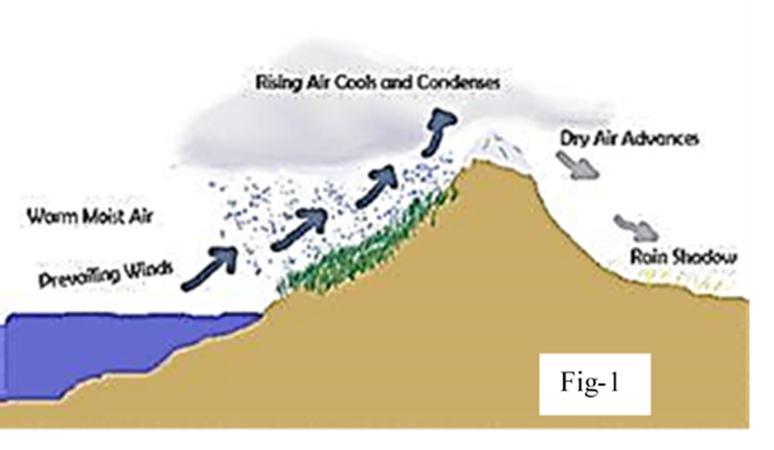
There are significant temperature differences between the air in valleys and air at the top of the mountains. In Figure 1, we see snows on top of Mount Kilimanjaro in Africa. While Mt Kilimanjaro is on the equator, the higher up you go on the mountain, it no longer has equatorial temperatures. It gets very cold. It’s so tall and massive that it creates its own sub-weather system. The top of the mountain is cold enough to snow and accumulate it. The low atmospheric pressure there literally sucks up much of the available water vapor/air from miles around its base. This rising air/ water vapor condenses and becomes clouds. Then it precipitates on the colder northern side of the mountain in the form of rain or snow, depending on temperature and pressure differences.

So, when it’s snowing on top of Kilimanjaro, say it’s 29° F, it

accumulates, but in the valley, below it maybe 80° F. Therefore, the hot air from the valley starts to rush up the mountain quickly, and when it reaches near the top, some of the snow melts in the air, and it rains. But some of the snow does something strange. Because of the lower boiling point at high elevations, the snow is heated so rapidly that it turns directly into water vapor, a process called sublimation. The snow is melting so fast that it does not bother to first liquefy into water. It goes straight to the gas phase, water vapor. As the cold air strips and condenses the water vapor as it’s sucked up the mountain, it’s condensed on the colder mountainside. There it rains or snows, but the other, warmer side of the mountain, is an arid wasteland. Ecologically speaking, the weather system is in a dynamic balance, but the people, animals, and vegetation on the mountain’s wrong side have difficult living conditions. A balanced ecosystem is not necessarily a good” system for all.

An even more prominent example of this extreme temperature/pressure difference and its cycle is in the tropical Pacific Ocean. Here this similar upward rush of air from the western Pacific Ocean to the sky is so fast that it is the primary driver of the now- familiar and periodic El Niño, which creates a temporary atmosphere and is the air/water equivalent to that of Kilimanjaro. After some years, the process reverses, causing the cooling cycle, which we call La Niña. This cycle was only recently discovered, and we still have a lot to learn about it.

THE WATERS

Let’s now compare the properties of water and water vapor and see how they affect the weather. Keep in mind that 20-30 percent of the Sun’s’ energy never reaches the land or the oceans. Some is reflected back to outer space by the air and the clouds, and some is absorbed by the atmosphere and clouds.

More than 70 percent of the Earth’s surface is covered and filled with water, accounting for about 96 percent of all Earth’s water. The rest of the 4 percent exists as water vapor in the air, flowing in rivers, stored in lakes, in icecaps and glaciers, and in the ground as soil moisture and as groundwater in aquifers.

How water heats up, cools down, loses, and redistributes the Sun’s heat is very different than how the land and air do it. Water, primarily in the oceans, receives the Sun’s rays. Before the rays penetrate the shallow surface water, a significant amount is reflected by the water back through the air, where some is stored in the air and /clouds, which createsthe greenhouse effect.” The seas absorb the rest of the Sun’s rays/heat. But water absorbs the Sun’s energy/heat, mostly from the infrared rays (IR) and the visible wavelengths, and it does so much more slowly than land. The oceans can absorb and store four times more heat than the air. The heated water on top expands, which makes it is less dense than the colder water. As a result, the warmer waters keep rising to the top layers; whereas, the more frigid, denser waters sink and keep sinking to the bottom. At great depths, these colder waters remain for centuries or even many millennia.

The warmer waters generally stay within 100-200 meters from the ocean top, and the temperatures keep declining as we go deeper and deeper. These top 100 meters of warmer waters may move at about one or two miles per hour and may take a decade or more to redistribute and mix with adjacent cooler waters. But they are still generally limited to the top 100-200 meters. The coldest of the cold waters are at the deepest parts of the ocean, and the mixing speeds there may be less than 1 one inch per century. The tiny amount of warmer water that is mixed with the colder waters below is generally limited to conduction. The warmer top layers in the seas are also why ocean ice, icebergs, and coastal glaciers will continue to melt around the waterline, even when the air temperature is below the freezing point.

Fascinating variations -- Weather made (sort of) understandable: Part Two 1 

This also explains why so much fog is over the oceans where the warm waters on the surface 

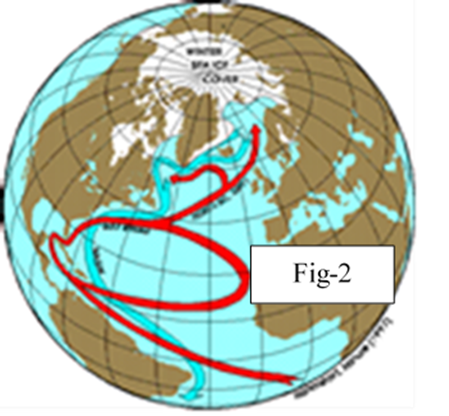
 continue to evaporate up and then condense as it comes into contact with the colder air on top. The different water temperatures of the oceans redistribute locally and over the planet at very different rates. The best-known example of this temperature redistribution is the Gulf Stream of the Atlantic Ocean. As seen in Figure – 2, the flow speeds of the top layers of the Gulf Stream can reach a breakneck pace of about 5 five miles per /hour. But it gets slower and slower as we go deeper and deeper. All told, it takes about 500 years for these top layers of water to complete the full Gulf Stream cycle.

In Part 3 of this series, we will close with a few more of the weather’s intricacies, which make those who can successfully forecast long-range, like months, not years, real superstars. Remember, most of us have not been taking the Farmer’s Almanac forecasts for the coming year too seriously, yet we actually pay attention to those that tell us the Earth is doomed in a decade or more.

Portions of this article are excerpted from the 2020 book A HITCHHIKER’S JOURNEY THROUGH CLIMATE CHANGE by Terigi Ciccone and Dr. Jay Lehr. The book is the best source for parents and grandparents to explain climate change reality to their children.  It’s especially recommended for young teens and Gen-Z as they will bear the consequences of climate change folly. 

Available from Amazon at https://www.amazon.com/Hitchhikers-Journey-Through-Climate-Change-ebook/dp/B086R49RS6 In kindle, black and white paperback and large format full-color figures. Or send an email to terigiciccone@gmail.com.

Author

  • CFACT Senior Science Analyst Jay Lehr has authored more than 1,000 magazine and journal articles and 36 books. Jay’s new book A Hitchhikers Journey Through Climate Change written with Teri Ciccone is now available on Kindle and Amazon.

  • Engineer, Science Enthusiast and Artist. Loves reading and travel, Naturalist, Author of the new book “A Hitchhiker’s Journey Through Climate Change.”


Wednesday, December 30, 2020

Weather made (sort of) understandable: Part One

Weather fluctuates... naturally. 

By , |December 10th, 2020 @ CFACT

Brace yourself.

This is a bit difficult to grasp. Heat is the random motion of atoms, molecules, and other subatomic particles in a system. A system maybe a glass of water or a cloud or the planet Earth and everything else in the universe. Temperature is how we measure the energy of this motion. We measure it in

degrees Fahrenheit, Celsius, Kelvin, or electrically with millivolts or spectral wavelengths and even in more exotic ways. So, if we put more energy into a system, say, like heating a pot of water, the motion and speed of the atoms in the water increases, as does the energy of the molecules colliding at higher speeds. Faster speeds mean more collisions and more powerful collisions. Similarly, the same thing is happening with the water container and the stove rack it sits on, and all connected things start heating as well (Fig. 1).

Conversely, if we chill the same pot, the motions of those same atoms and molecules slow down, and the temperature goes down. If we chill the system, say, a beaker of water to almost absolute zero (-273 degrees C), nearly all that motion stops, and weird things start to happen, like super electrical conductivity and bizarre quantum stuff we can set aside. Currently, we do not know how to chill something to absolute zero. For now, let’s focus on heat as it relates to weather and climate.

Now comes the question, how does heat move? How do we get heat from one thing to another? Like from the sun to the Earth or from the flame to the pot as pictured in Fig. 2?

There are three ways heat moves from hot to cold. They are convection, conduction, and radiation. In addition, you should know that heat never moves to a hotter body from a less hot body.

– Convection is what you experience when holding your hands over a bonfire, where the hotter air near the flame rises to the cooler air and warms your cold hands.

– Conduction is like warming your hands by wrapping them around a hot cup of coffee.

– Radiation happens when I put my hands beside the bonfire, and the infrared portion of the light waves travels from the flame to my hands by electromagnetic waves. Sometimes we get one or more of these methods working at the same time.

Now let’s take a look at the water in the pot and see what happens when we put water at 20 degrees C on a burner and turn on the heat. We look at the thermometer, and the red line starts going up. The question is, how high will it go? You might expect it will go to its boiling point at 100 degrees C. We are then surprised as we keep watching it and see that when it gets to about 90 degrees C, it stops. What happened? The heat from the warmer pot and water moves to the other cooler things in the room because nature does not like any temperature imbalance.

So, when we start the flame, it starts to heat the water, but it also starts heating everything around it. Not all of the heat goes from the flame to the water. Some of the heat goes to the pot, some of the heat from the flame, pot, and water goes to the air, you, the walls, etc. Moreover, if we turn on a fan and blow the warm air away from the container, it will accelerate this heat transfer to the surrounding stuff. Perhaps with the fan on, the water temperature in the container can only get to 70 degrees C. But we can get it back up to 90 degrees C or more if we turn up the flame. Do you recognize now all the variables in nature’s efforts to balance heat on the Earth itself?

We can also flip this heat/motion thing on its head. For example, in Fig. 3, we see that if you take a big hammer and smash it on an anvil hard, then put your hand on the anvil or the hammer, you will feel it has turned hot. Or if you smash it with a little hammer, then it only heats up a bit. So, we can change heat (thermal energy) to kinetic energy (energy of motion) and back the other way. This is called a reversible reaction.

Now comes the fun part. Energy will always move in one direction and never the other way around (high to low, hot to cold, fast to slow). We use this phenomenon in thousands of different ways every day without even knowing it. Engineers and scientists call this the second law of thermodynamics.” If I put an ice cube on top of a hot pan, the pan’s heat moves to the ice cube by one or more of the three means described above until the temperature difference is eliminated. Similarly, in this case, the heat from the pan warms up the ice cube until it melts and keeps heating it until the water turns to steam and vaporizes. With all the water gone, the stove continues to heat all the other stuff in the kitchen until a new higher temperature equilibrium is reached.

In weather and climate, this is a fundamental concept, as it explains many things. It describes how the sun warms the air, sea, and land during the day and why and how it cools at night. It also helps to explain how the oceans store heat and how that heat is redistributed around the planet in a vain effort to eliminate all heat and energy differences. Another thing it explains is how that heat is distributed around the globe in a futile attempt to reduce all heat and energy differences.

SOURCES OF HEAT

How about the Earth itself? There is a considerable scientific debate on how much or how significant this heat is. In a July 19, 2011 article in Physics World, a group of scientists estimated this internal heat to be approximately 50 percent of the total heat that is radiated from the Earth into outer space. Others consider that figure to be only a few percent. The debate will likely continue for a long time because it appears impossible to measure, or even to estimate. Also, what remains a significant unknown is how much of this core heat is generated by the radioactive decay of Uranium and Thorium versus how much is from the primordial energy left from Earth’s formation.

Eons ago, kinetic energy from the asteroids and meteors smashing to the Earth (remember the hammer hitting the anvil?) imparted a lot of energy into the Earth’s core. We know that this internal heat (nuclear plus residual) accounts for the molten core that generates the Earth’s magnetic field and protects us from some of the sun’s solar cosmic rays and solar winds. It’s also the same energy that moves the tectonic plates around the planet and occasionally results in volcanic eruptions, earthquakes, and tsunamis. It is also the source of the geothermal power used in countries like Greenland and Iceland to make electricity and entertains us as we watch “Old Faithful” periodically explode at Yellowstone National Park. For climate change purposes, we can’t control this internal heat, which we can’t even measure. Therefore, we’ll treat it as a constant and “ignore it” until better data becomes available. Other sources can be natural

like a forest fire or human-made sources such as factories and automobiles.

Human-made heat comes in two varieties. The first is the direct sources, like the chemical discharge of combustion at power plants, or cars, trucks, and waste heat from electrical power plants. Then there is indirect “heating” by the retention and storing of heat by the greenhouse effect. Note that CO2 does not provide any heat by itself, but it does help the Earth retain some heat by preventing it from escaping to outer space too quickly.

At our visual level, you can see heat as a simple subject. At the Atomic-level it is very complicated. For nature, it is the reason for everything that occurs in our weather and climate.

For more information on the subject, we recommend our book A Hitchhikers Journey Through Climate Change.


Author

  • CFACT Senior Science Analyst Jay Lehr has authored more than 1,000 magazine and journal articles and 36 books. Jay’s new book A Hitchhikers Journey Through Climate Change written with Teri Ciccone is now available on Kindle and Amazon.

  • Engineer, Science Enthusiast and Artist. Loves reading and travel, Naturalist, Author of the new book “A Hitchhiker’s Journey Through Climate Change.”


Monday, January 2, 2012

Extreme Weather Forecast for the 2012 and 2014 Hurricane and Tornado Seasons

By James A. Marusek

Accurate long-range predictions of the intensity of upcoming hurricane and tornado seasons have eluded forecasters for many decades. These types of storms, by their very nature, are raw chaos unfolding.

In 2006, a relationship between major (Saffir/Simpson category 3-4-5) Atlantic hurricanes and major (Fujita scale F4-F5) U. S. tornadoes was studied. A strong natural short-term cycle was observed overlaying the long-term multi-decadal cycles of hurricane and tornado activity. This research was presented in a paper titled "The Art of Forecasting Extreme Weather Events" at the Second International Conference on Global Warming and the Next Ice Age sponsored by Los Alamos National Laboratory in July 2006.

From this research, a forecasting tool was developed called the storminess model.

A forecasting tool is only as good as its ability to generate accurate predictions. The best way to test the tool's accuracy is to generate a forecast. To date, the storminess tool has made a total of three forecast and these subsequently were shown to be completely accurate. This is a long-range tool and the last two forecast were made over a year in advance of the targeted seasons.

The tool will now be used to forecast two seasons (2012 and 2014) at once.

The years 2010/2011 were a double-peak producing a total of 8 major Atlantic hurricanes and 36 major U. S. tornadoes. Because this was a double-peak, storminess levels will fall very dramatically in 2012. The year 2012 will not produce an extreme in either the number of major Atlantic hurricanes (Category 3 or greater) or in the number of major U. S. tornadoes (EF4 or EF5). The forecast is that the year 2012 will produce a maximum of 2 major Atlantic hurricanes and a maximum of 10 major U. S. tornadoes.

This fall of storminess levels in 2012 will cause the storminess index to drop below the lower threshold, which will set the stage for another extreme year in the future. It is very likely (83 percent probability) that the year 2014, will be another extreme weather year. Storminess in 2014 will produce either a minimum of five major Atlantic hurricanes or a minimum of 23 major U. S. tornadoes.

No forecast is made of the year 2013.

As always I am pleased to publish Jim's work. James Marusek is a retired U.S. Department of the Navy nuclear physicist and engineer. He has presented some of the best work on the sun's cycles I have seen and is now working on "the Weather Chronology". He sent me an e-mail recently saying; "I has added over 200 more pages to it. Most of those are U.S. weather events. It is now up to 802 pages and is a 12 megabyte file, so it might take a little time to download." it is still at the same location RK

###

Thursday, May 26, 2011

Extreme Weather Events

By James A. Marusek

(This first appeared on Jim's site Impact (http://www.breadandbutterscience.com/) on 26 May 2011 RK)

Hurricanes and tornadoes are some of the most destructive forces in nature. They are also the definition of pure chaos. They tend to occur with little warning and leave behind a path of great destruction. In 2005 and 2006, I peered through the dark shroud of events past, analyzing the data from 55 years of major Atlantic Hurricanes (Category 3‐5) and major North American tornadoes (F4 and F5) to see what could be learned. This groundbreaking study lead to the development of a forecasting tool, called the storminess analysis.

The results were presented in a paper, "The Art of Forecasting Extreme Weather Events", which was given at the Second International Conference on Global Warming and the Next Ice Age sponsored by Los Alamos National Laboratory in July 2006.

The analysis uncovered two significant trends:
• It was already recognized that major Atlantic hurricanes occur in long‐term multidecadal cycles. This analysis showed that the same is true for major North American tornadoes, they also occur in long‐term multi‐decadal cycles.
• The analysis showed that the annual number of major Atlantic hurricanes had an inverse relationship with the annual number of major North American Tornadoes. Peak tornado years produced minimal hurricanes. And peak hurricane years produced minimal tornadoes.
Since this was an inverse relationship, it was felt that combining both major hurricanes and tornadoes into one metric called storminess might be productive. Once this was done, a very intense short‐term cycle became visible. A forecasting tool was then developed based on this pulse cycle. A forecasting tool is only as good as its ability to generate accurately predictions. And the best way to measure the tool's accuracy is to generate forecasts.

This was done with great success in 2006 and 2008. The third tests for this tool was for this year, 2011. The following forecast was generated over a year ago and published in the Greene County Daily World: “It is very likely (82 percent probability) that next year, the year 2011, will be another extreme weather year. If the multi‐decadal cycle remains in the strong hurricane phase, the year will likely produce a minimum of five major Atlantic hurricanes.

 But this strong hurricane phase began in 1995 and this cycle will be coming to an end soon. If this occurs in 2011, storminess rather than producing an extreme hurricane season; might materialize as a strong tornado season likely producing a minimum of 23 major U.S. tornados (Enhanced Fujita scale EF4‐EF5).”

This year already produced 19 major U.S. tornados and the year is still early. Perhaps it is time to end the long tradition of throwing good money after bad by supporting models based on the unfounded Global Warming Theory that only demonstrates success in predicting events after they happen. And instead invest in tools with a proven track record in making successful future long‐range predictions.

###