I sometimes feel like a broken record about entitlement programs. How many times, after all, can I point out that America is on a path to become a decrepit European-style welfare state because of a combination of demographic changes and poorly designed entitlement programs?
 But I can’t help myself. I feel like I’m watching a surreal version of Titanic where the captain and crew know in advance that the ship will hit the iceberg, yet they’re still allowing passengers to board and still planning the same route. And in this dystopian version of the movie, the tickets actually warn the passengers that tragedy will strike, but most of them don’t bother to read the fine print because they are distracted by the promise of fancy buffets and free drinks.
We now have the book version of this grim movie. It’s called The 2017 Long-Term Budget Outlook and it was just released today by the Congressional Budget Office.
If you’re a fiscal policy wonk, it’s an exciting publication. If you’re a normal human being, it’s a turgid collection of depressing data.
But maybe, just maybe, the data is so depressing that both the electorate and politicians will wake up and realize something needs to change.
I’ve selected six charts and images from the new CBO report, all of which highlight America’s grim fiscal future.
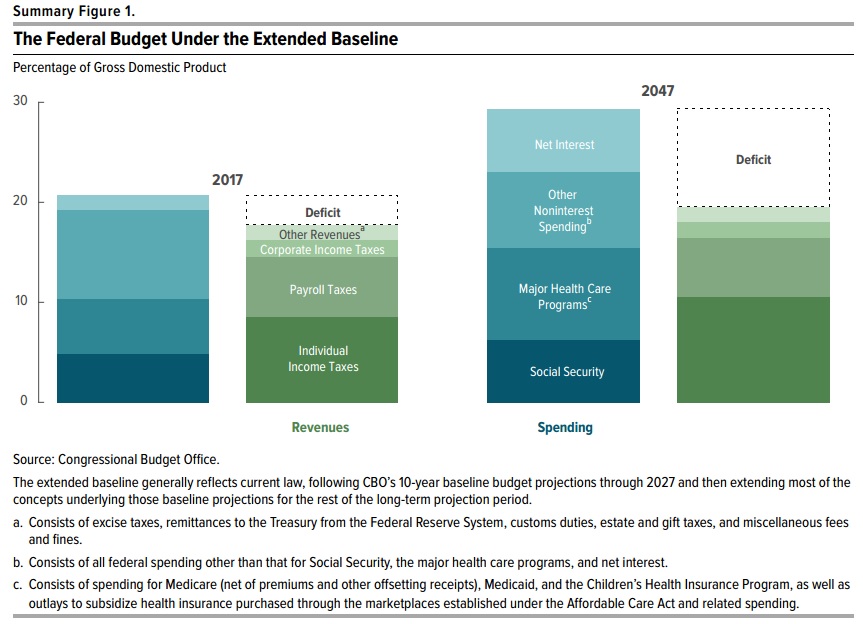
The first chart simply shows where we are right now and where we will be in 30 years if policy is left on autopilot. The most important takeaway is that the burden of government spending is going to increase significantly.

Interestingly, even CBO openly acknowledges that rising levels of red ink are caused solely by the fact that spending is projected to increase faster than revenue.

And it’s also worth noting that revenues are going up, even without any additional tax increases.
The bottom part of this chart shows that revenues from the income tax will climb by about 2 percent of GDP. In other words, more than 100 percent of our long-run fiscal mess is due to higher levels of government spending. So it’s absurd to think the solution should involve higher taxes.

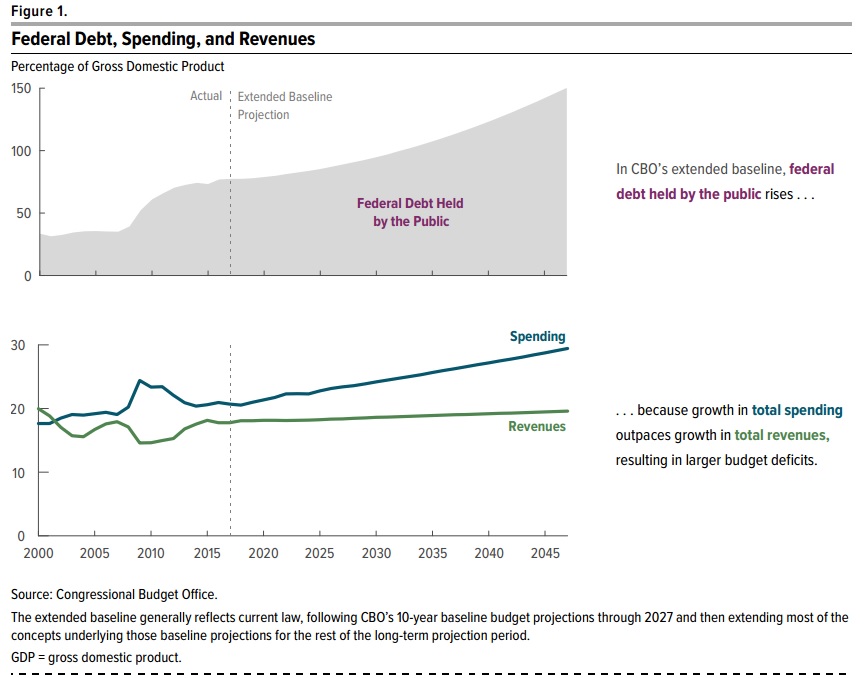
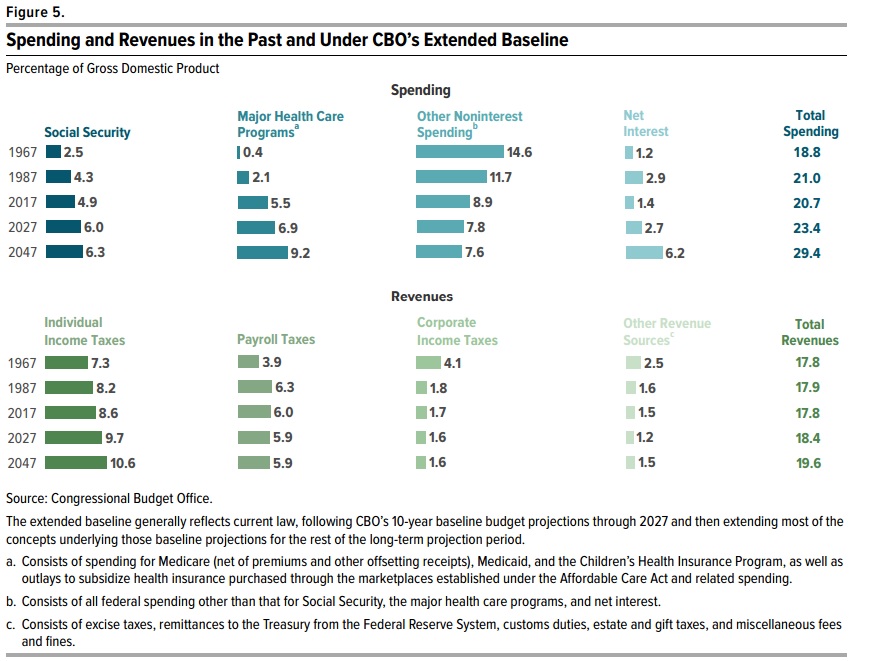
This next image digs into the details. We can see that the spending burden is rising because of Social Security and the health entitlements. By the way, the top middle column on “other noninterest spending” shows one thing that is real, which is that defense spending has fallen as a share of GDP since the mid-1960s, and one thing that may not be real, which is that politicians somehow will limit domestic discretionary spending over the next three decades.
This bottom left part of the image also gives the details on built-in growth in revenues from the income tax, further underscoring that we don’t have a problem of inadequate revenue.

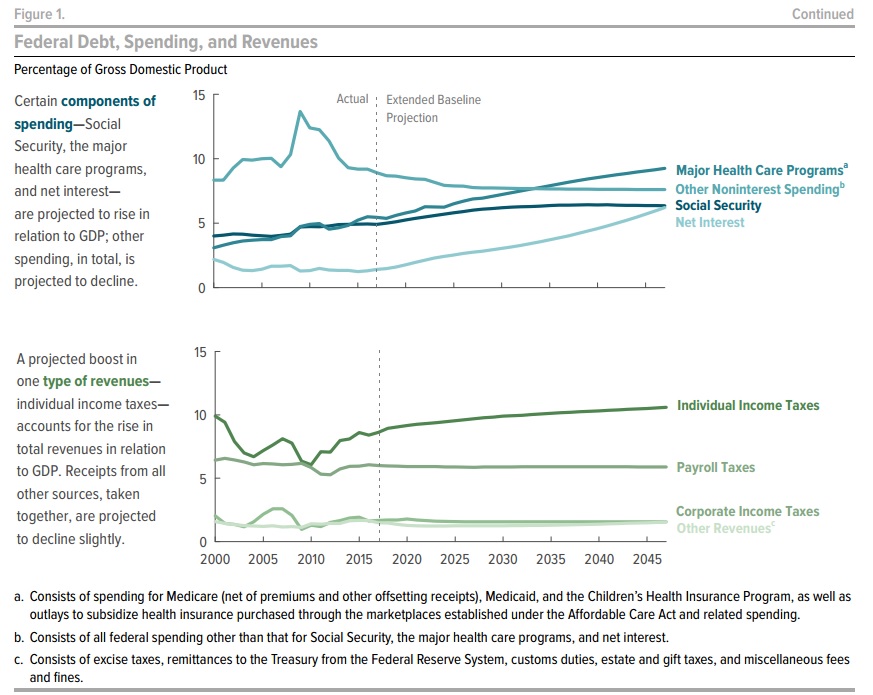
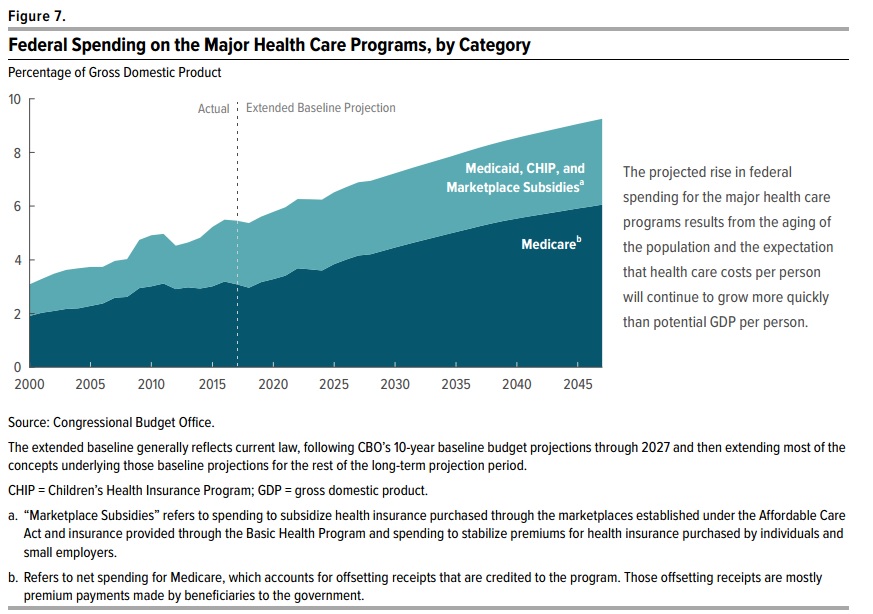
Here’s a chart that shows that our main problem is Medicare, Medicaid, and Obamacare.

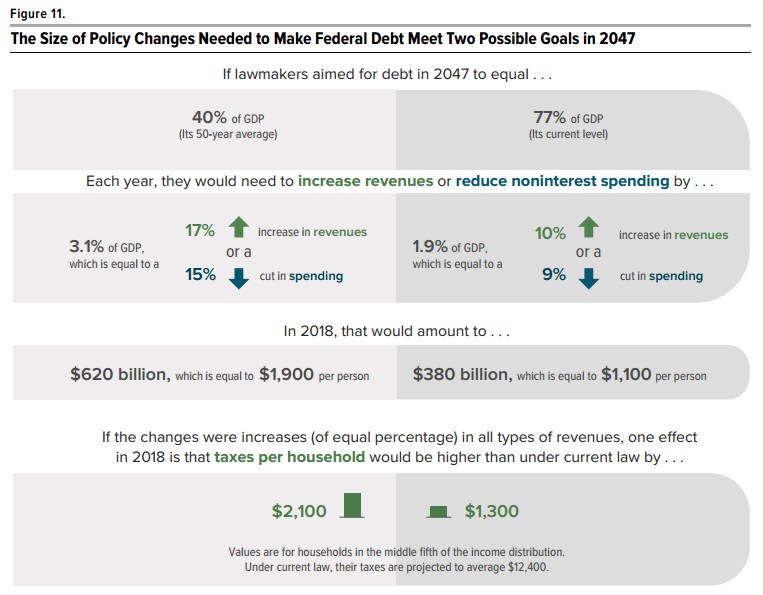
Last but not least, here’s a graphic that shows the amount of fiscal policy changes that would be needed to either reduce or stabilize government debt.
I think that’s the wrong goal, and that instead the focus should be on reducing or stabilizing
 the burden of government spending, but I’m sharing this chart because it shows that spending would have to be lowered by 3.1 percent of GDP to put the nation on a good fiscal path.
Some folks think that might be impossible, but I’ll simply point out that the five-year de facto spending freeze that we achieved from 2009-2014 actually reduced the burden of government spending by a greater amount.
In other words, the payoff from genuine spending restraint is enormous.

The bottom line is very simple.
We need to invoke my Golden Rule so that government grows slower than the private sector. In the long run, that will require genuine entitlement reform.
Or we can let America become Greece.
But I can’t help myself. I feel like I’m watching a surreal version of Titanic where the captain and crew know in advance that the ship will hit the iceberg, yet they’re still allowing passengers to board and still planning the same route. And in this dystopian version of the movie, the tickets actually warn the passengers that tragedy will strike, but most of them don’t bother to read the fine print because they are distracted by the promise of fancy buffets and free drinks.We now have the book version of this grim movie. It’s called The 2017 Long-Term Budget Outlook and it was just released today by the Congressional Budget Office.
If you’re a fiscal policy wonk, it’s an exciting publication. If you’re a normal human being, it’s a turgid collection of depressing data.
But maybe, just maybe, the data is so depressing that both the electorate and politicians will wake up and realize something needs to change.
I’ve selected six charts and images from the new CBO report, all of which highlight America’s grim fiscal future.
The first chart simply shows where we are right now and where we will be in 30 years if policy is left on autopilot. The most important takeaway is that the burden of government spending is going to increase significantly.
Interestingly, even CBO openly acknowledges that rising levels of red ink are caused solely by the fact that spending is projected to increase faster than revenue.
And it’s also worth noting that revenues are going up, even without any additional tax increases.
The bottom part of this chart shows that revenues from the income tax will climb by about 2 percent of GDP. In other words, more than 100 percent of our long-run fiscal mess is due to higher levels of government spending. So it’s absurd to think the solution should involve higher taxes.
This next image digs into the details. We can see that the spending burden is rising because of Social Security and the health entitlements. By the way, the top middle column on “other noninterest spending” shows one thing that is real, which is that defense spending has fallen as a share of GDP since the mid-1960s, and one thing that may not be real, which is that politicians somehow will limit domestic discretionary spending over the next three decades.
This bottom left part of the image also gives the details on built-in growth in revenues from the income tax, further underscoring that we don’t have a problem of inadequate revenue.
Here’s a chart that shows that our main problem is Medicare, Medicaid, and Obamacare.
Last but not least, here’s a graphic that shows the amount of fiscal policy changes that would be needed to either reduce or stabilize government debt.
I think that’s the wrong goal, and that instead the focus should be on reducing or stabilizing
the burden of government spending, but I’m sharing this chart because it shows that spending would have to be lowered by 3.1 percent of GDP to put the nation on a good fiscal path.Some folks think that might be impossible, but I’ll simply point out that the five-year de facto spending freeze that we achieved from 2009-2014 actually reduced the burden of government spending by a greater amount.
In other words, the payoff from genuine spending restraint is enormous.
The bottom line is very simple.
We need to invoke my Golden Rule so that government grows slower than the private sector. In the long run, that will require genuine entitlement reform.
Or we can let America become Greece.
No comments:
Post a Comment